Home Assistant

trigBoard can send to Home Assistant out of the box! If you’re already familiar with Home Assistant, then you already know how powerful this is and will be very happy to find that you can integrate the trigBoard in just a few steps. This takes the trigBoard to a new level, because now you can tie this in to alerts, automations, monitoring, etc… It’s also very easy to add sensors to the trigBoard and provide that additional data to your system.
Home Assistant Setup
First step is to make sure you have Home Assistant Installed (if you don’t already) - head over here and follow these steps: Home Assistant Installation
Note - I am running Home Assistant on a Raspberry Pi 3 64bit
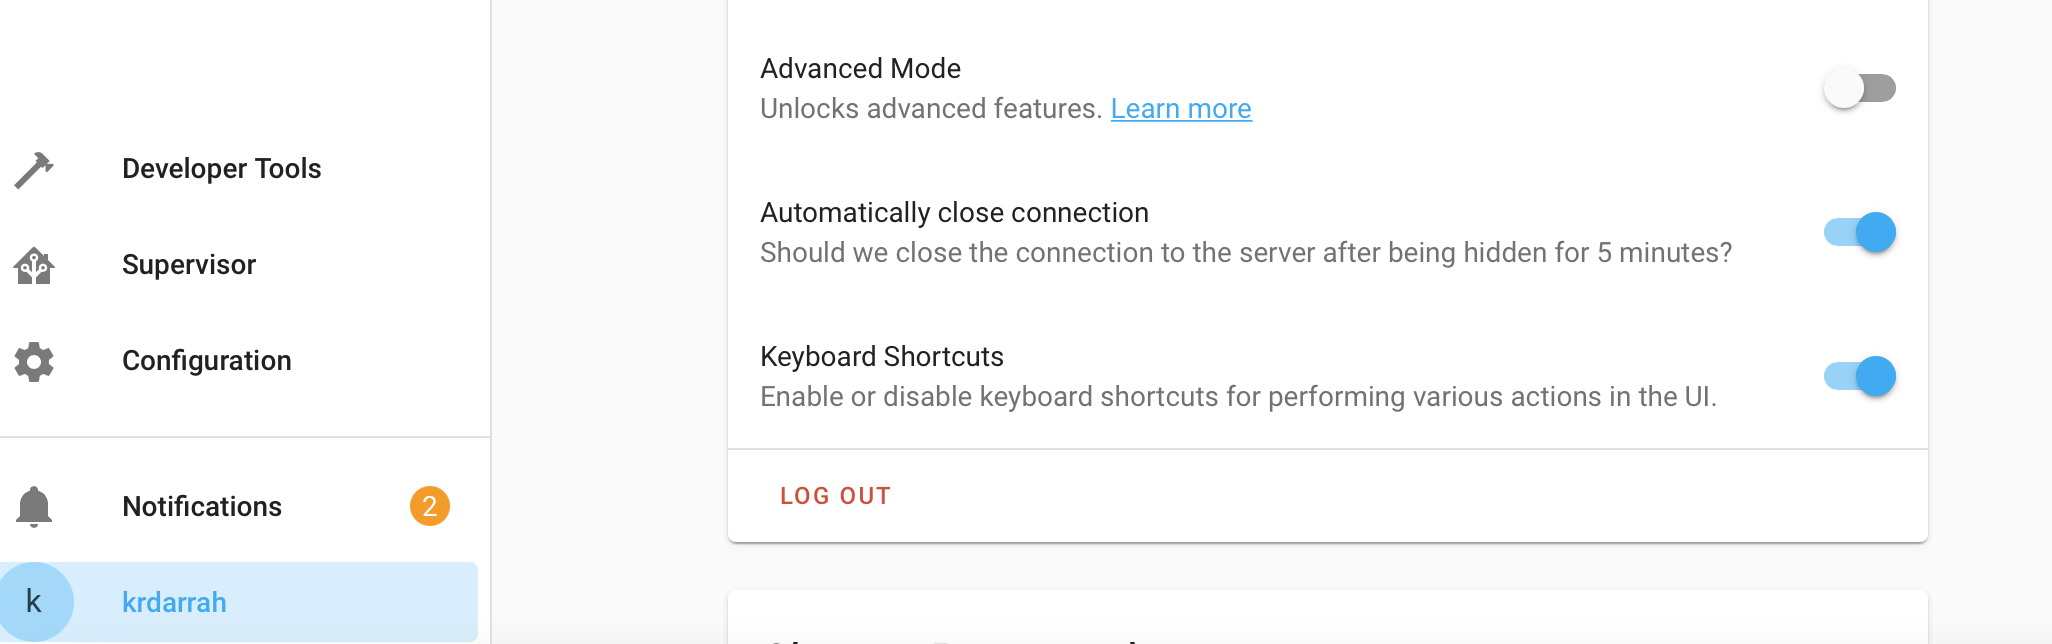
Make sure you’re in advanced mode:
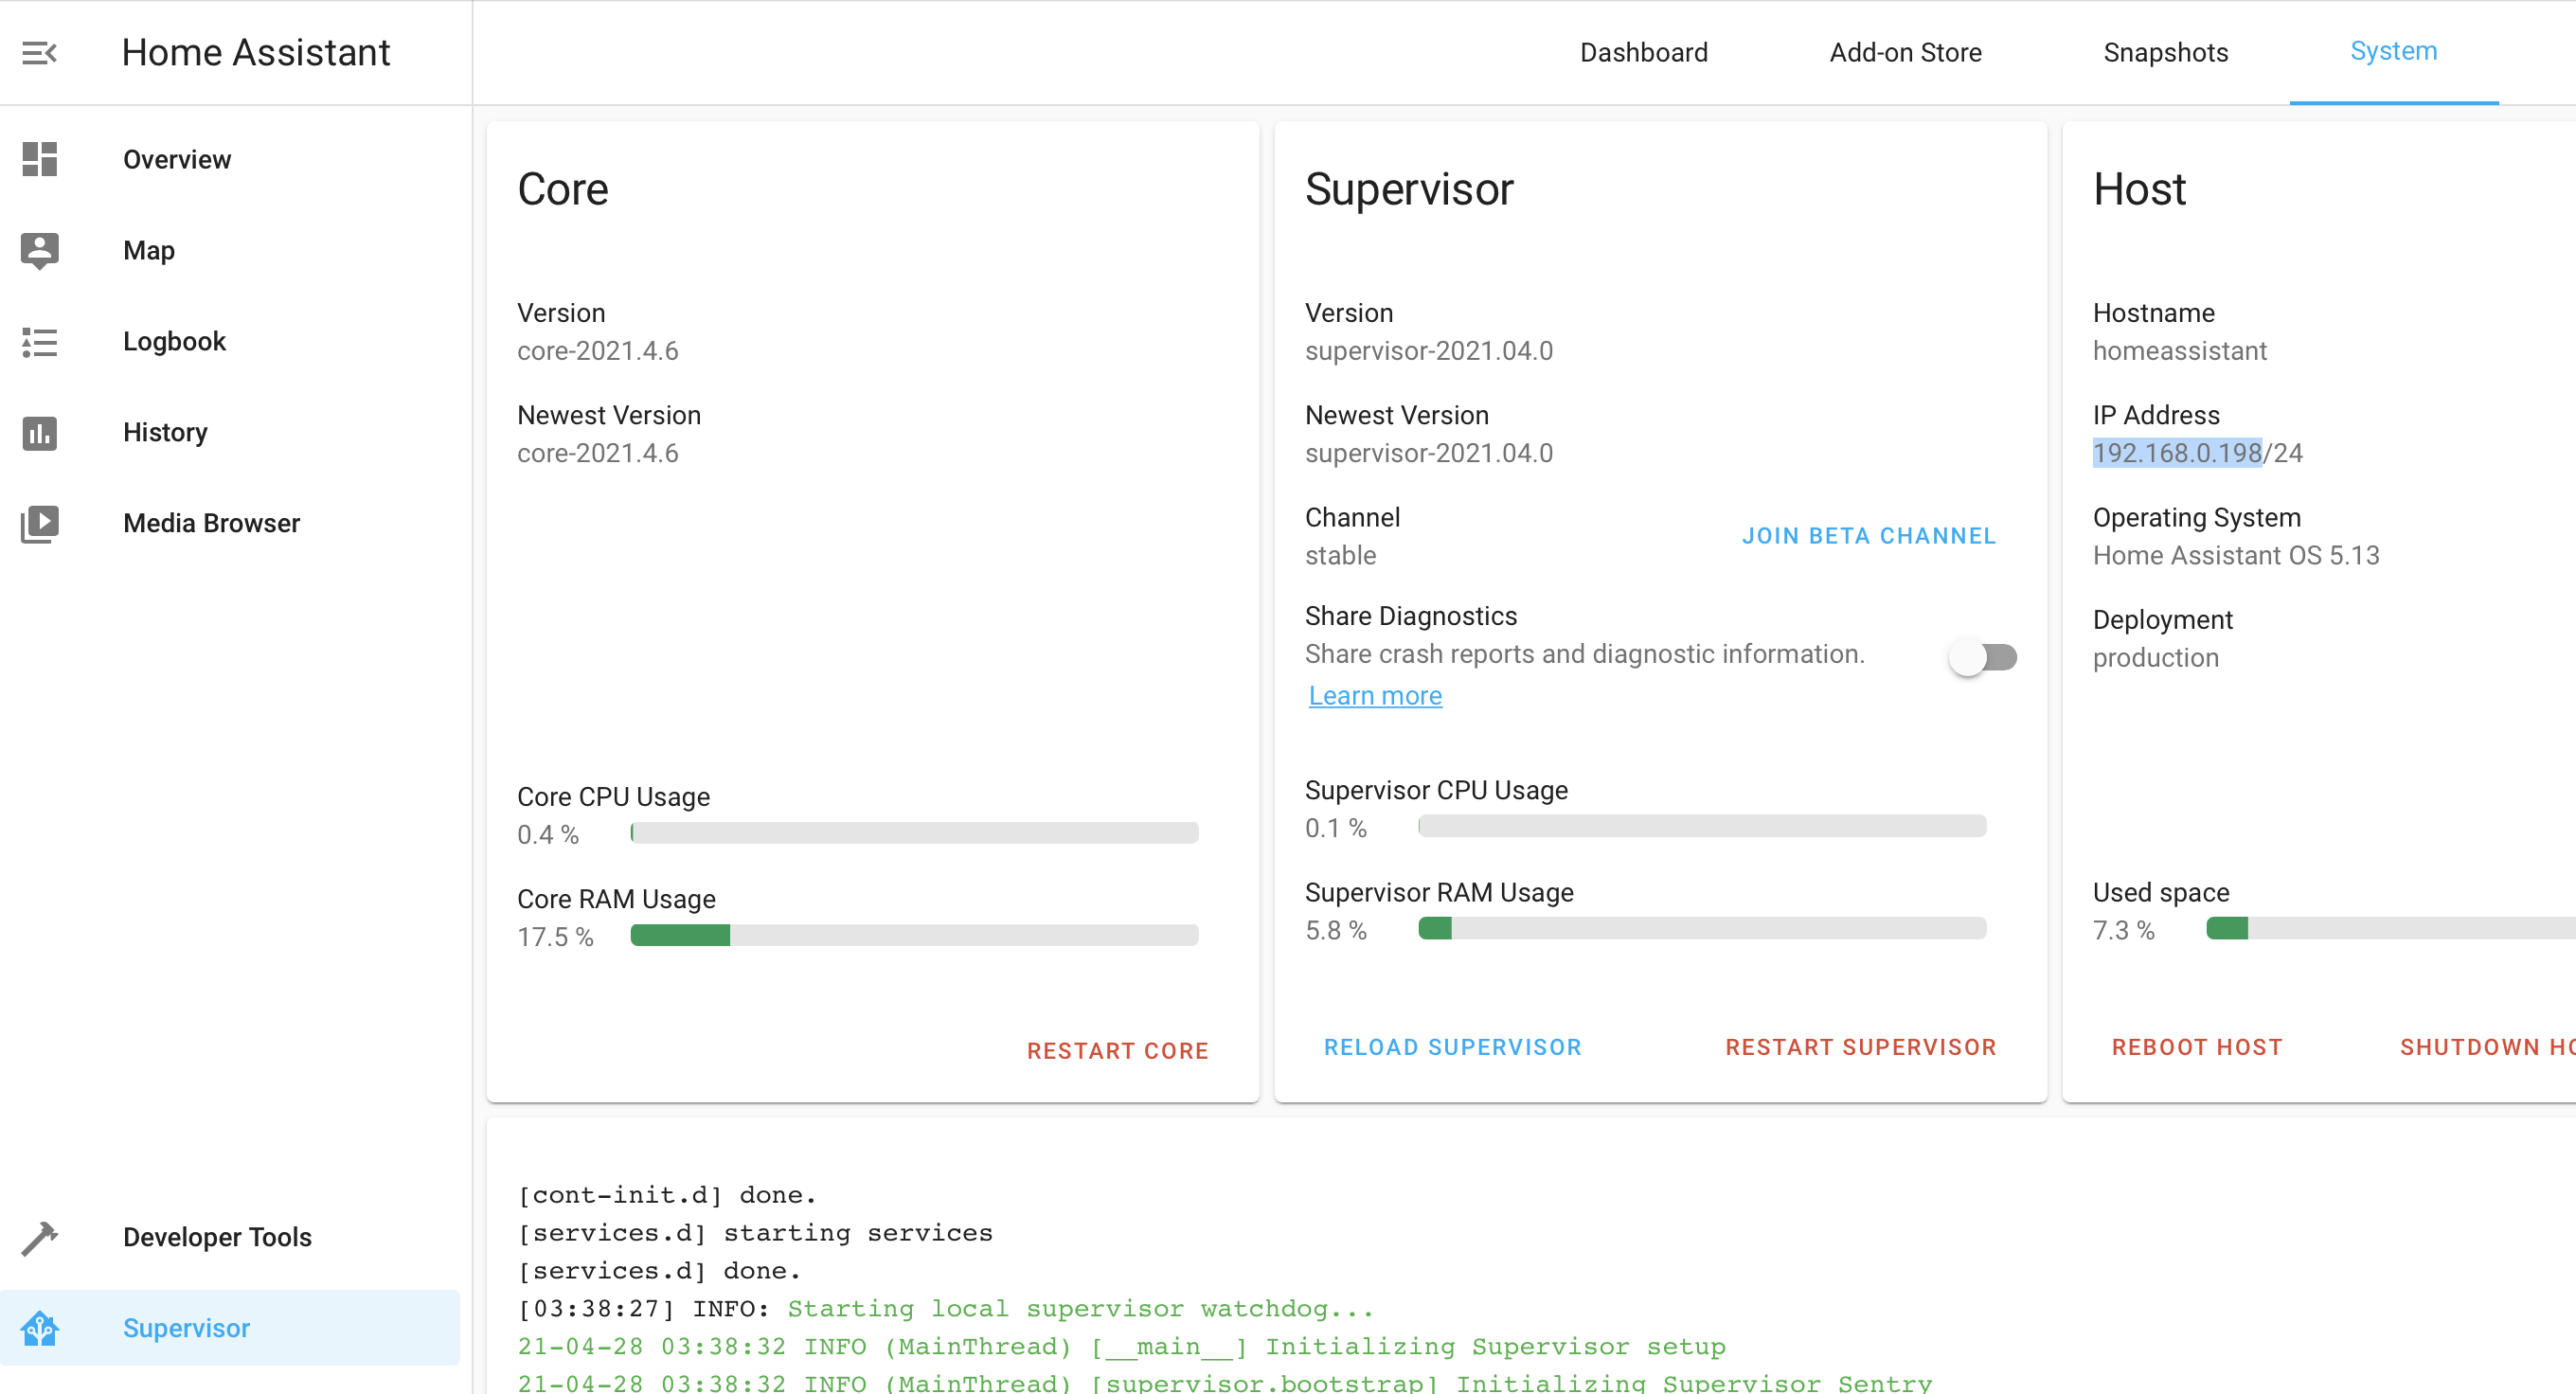
Take note of the IP address:
MQTT Mosquitto Broker Add-On
Supervisor>>Add-on Store
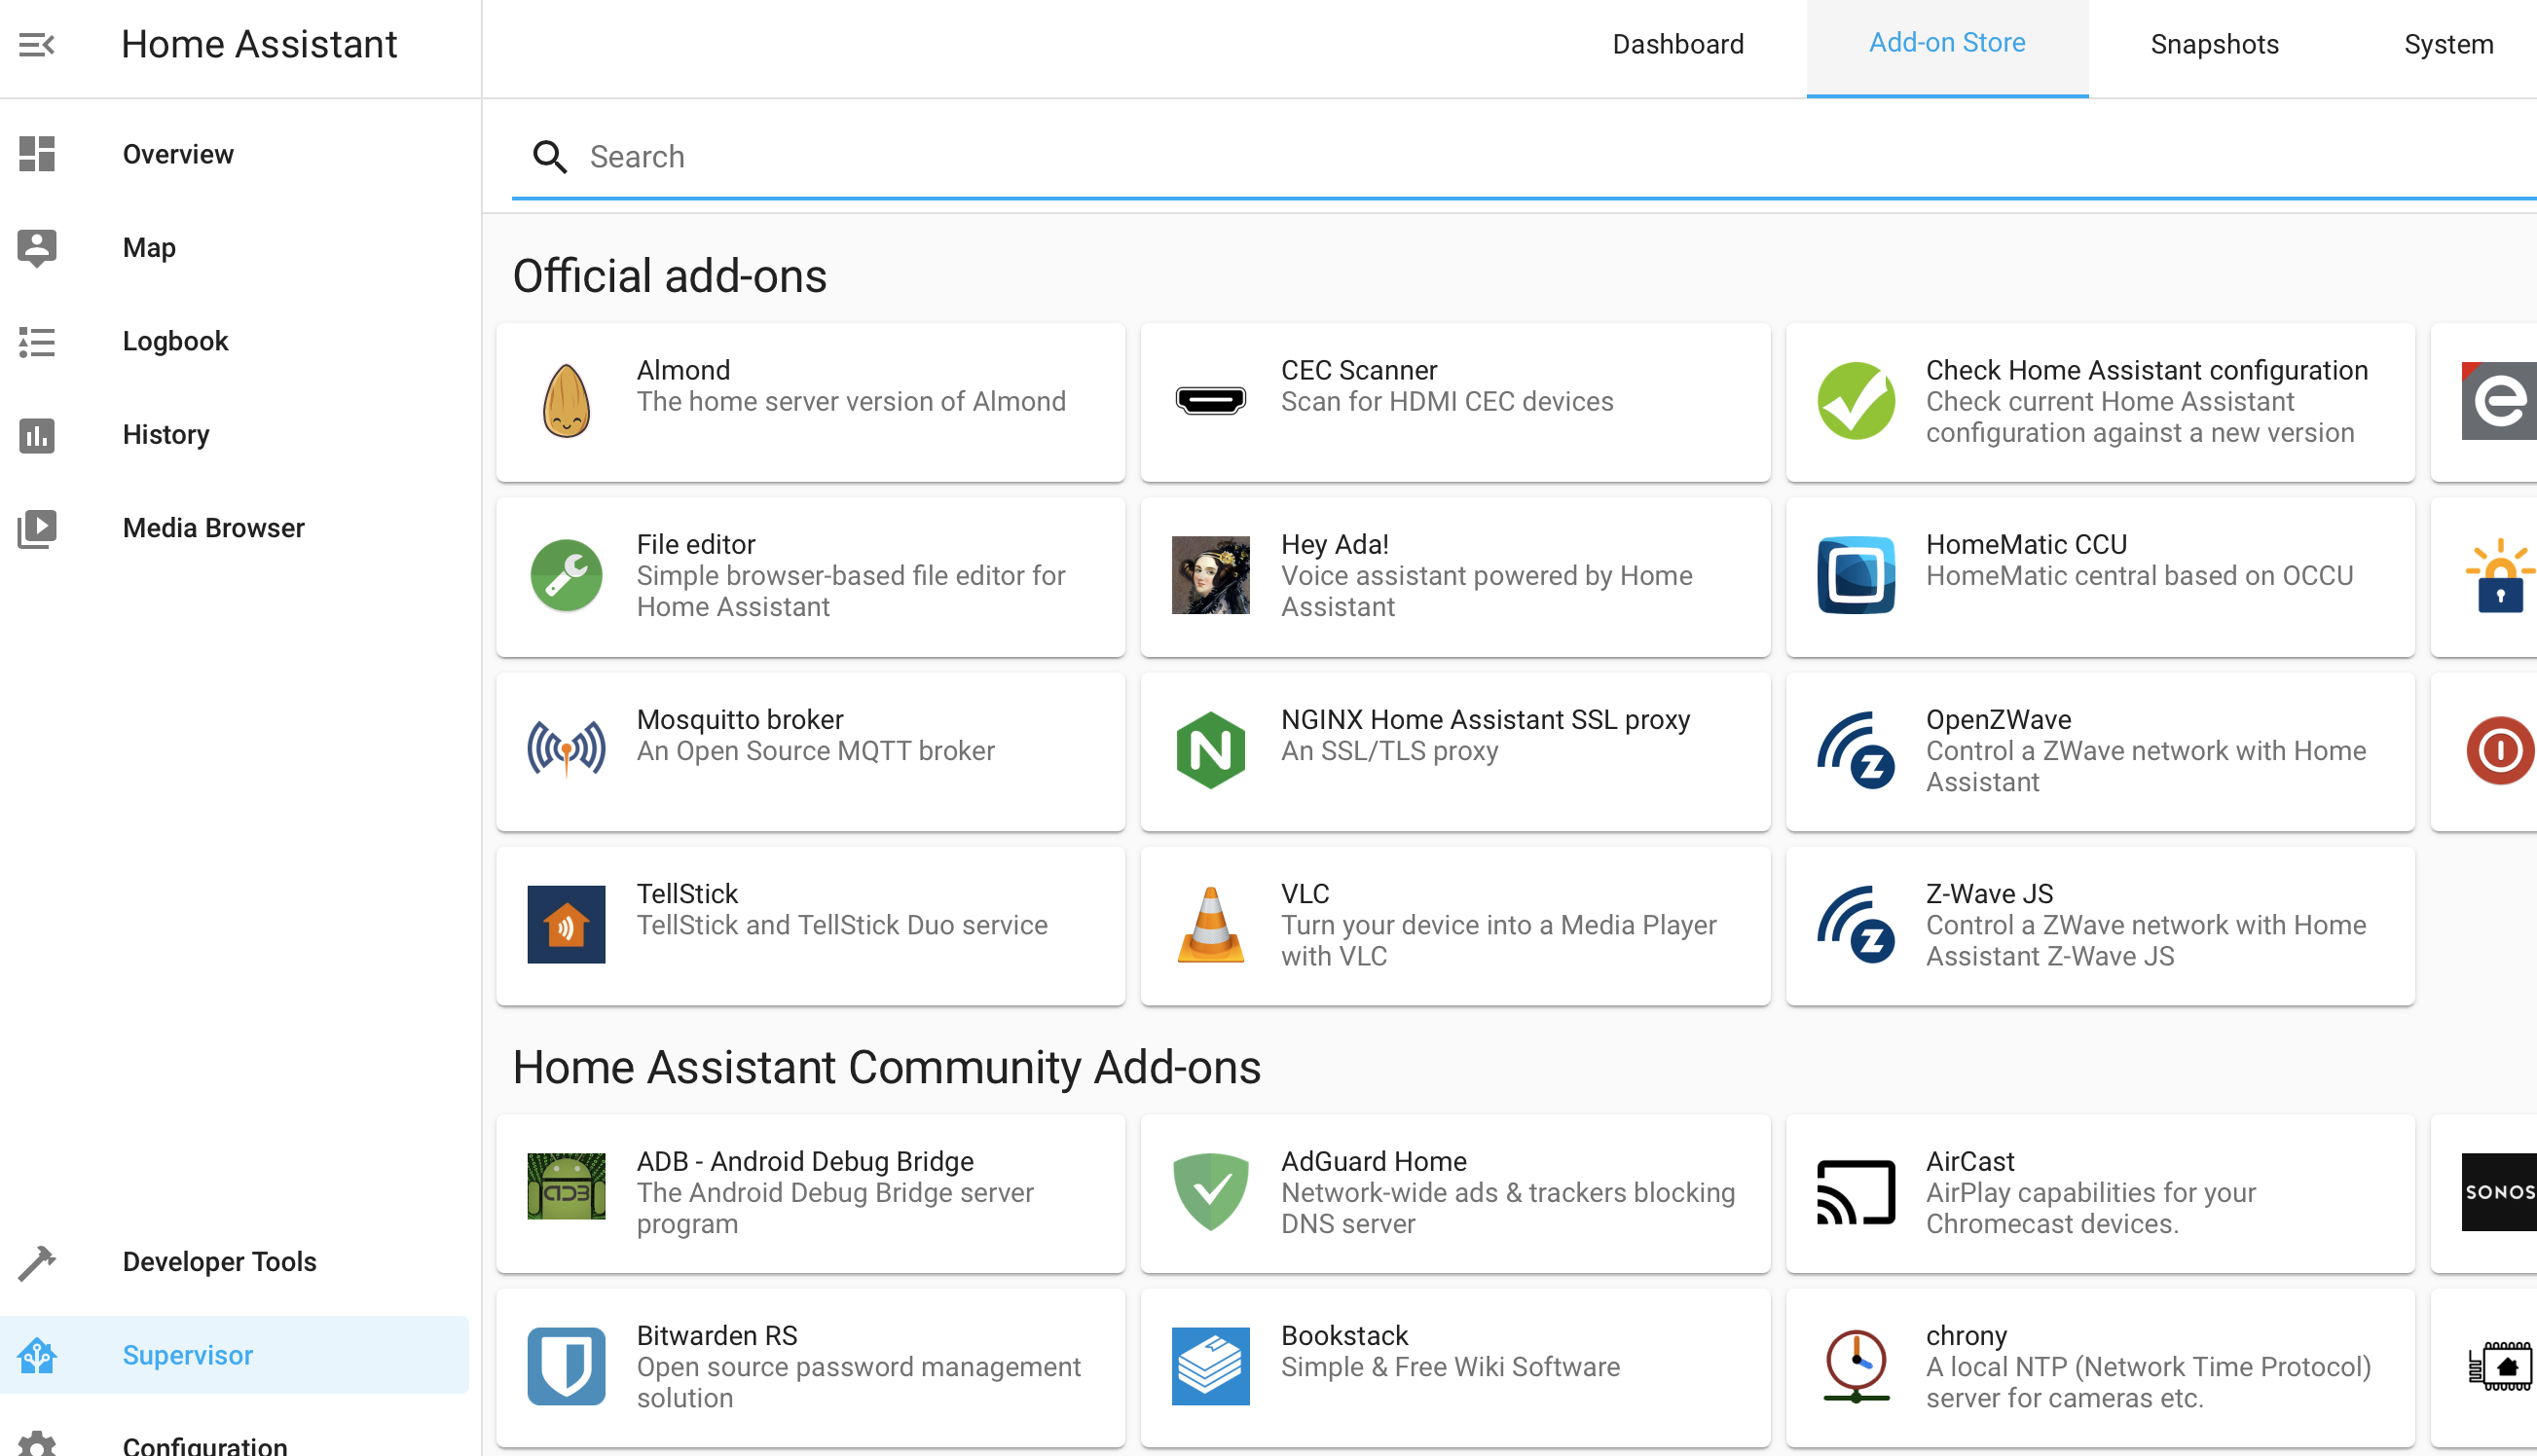
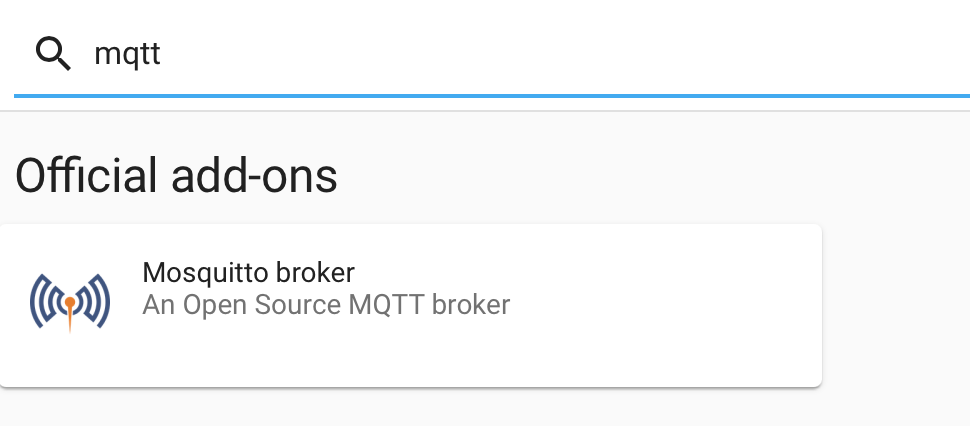
Search for “mqtt”
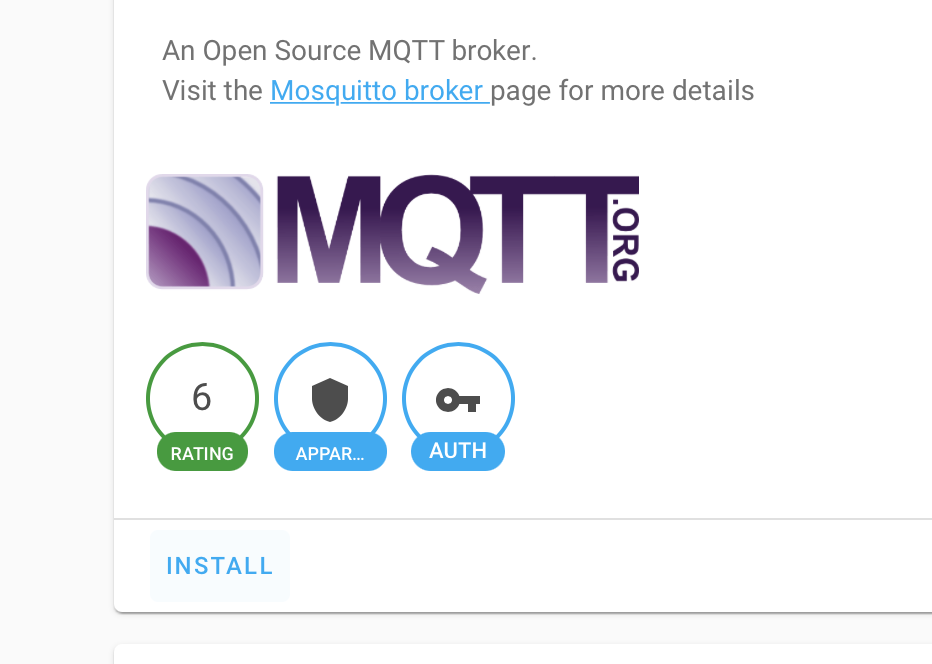
Go and install, then start:
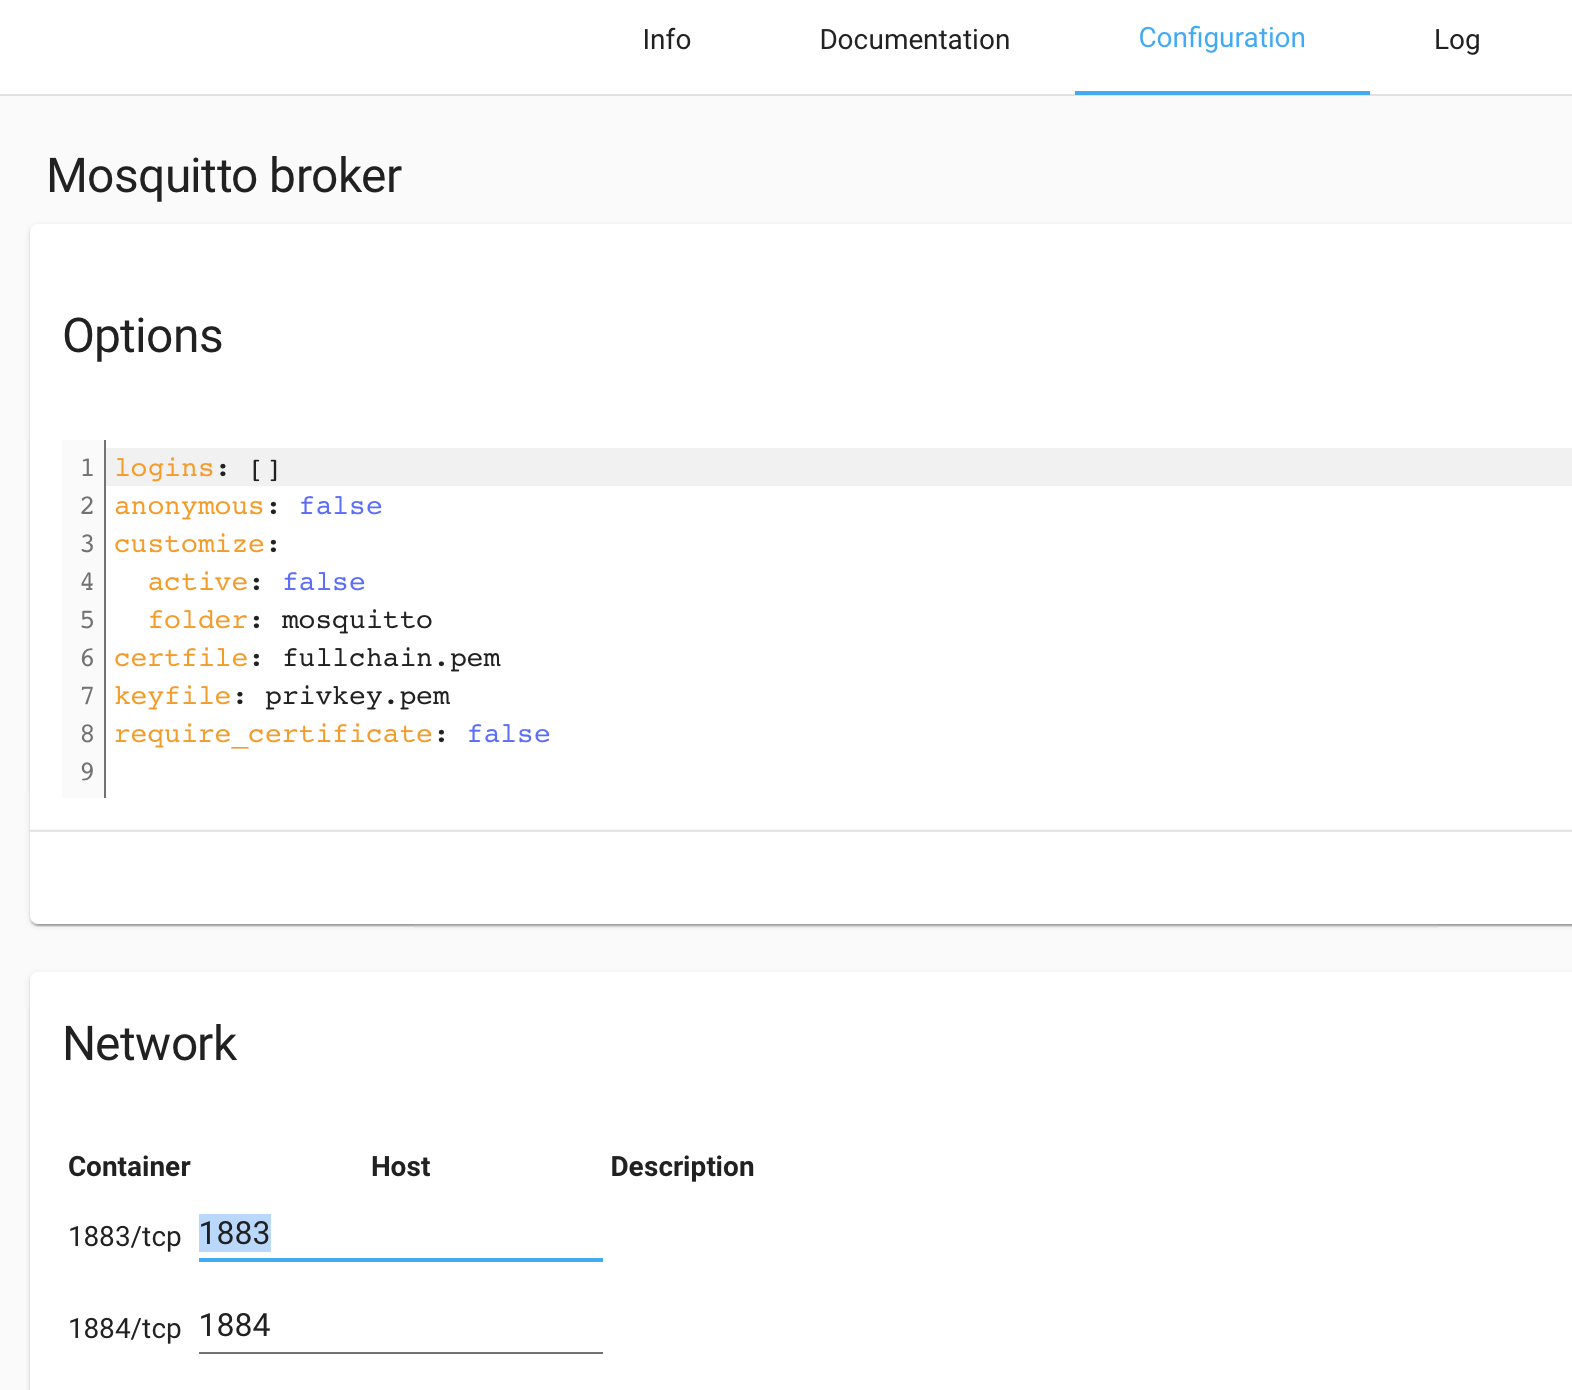
Then just for reference, here is my configuration tab and note the MQTT port we’re going to use:
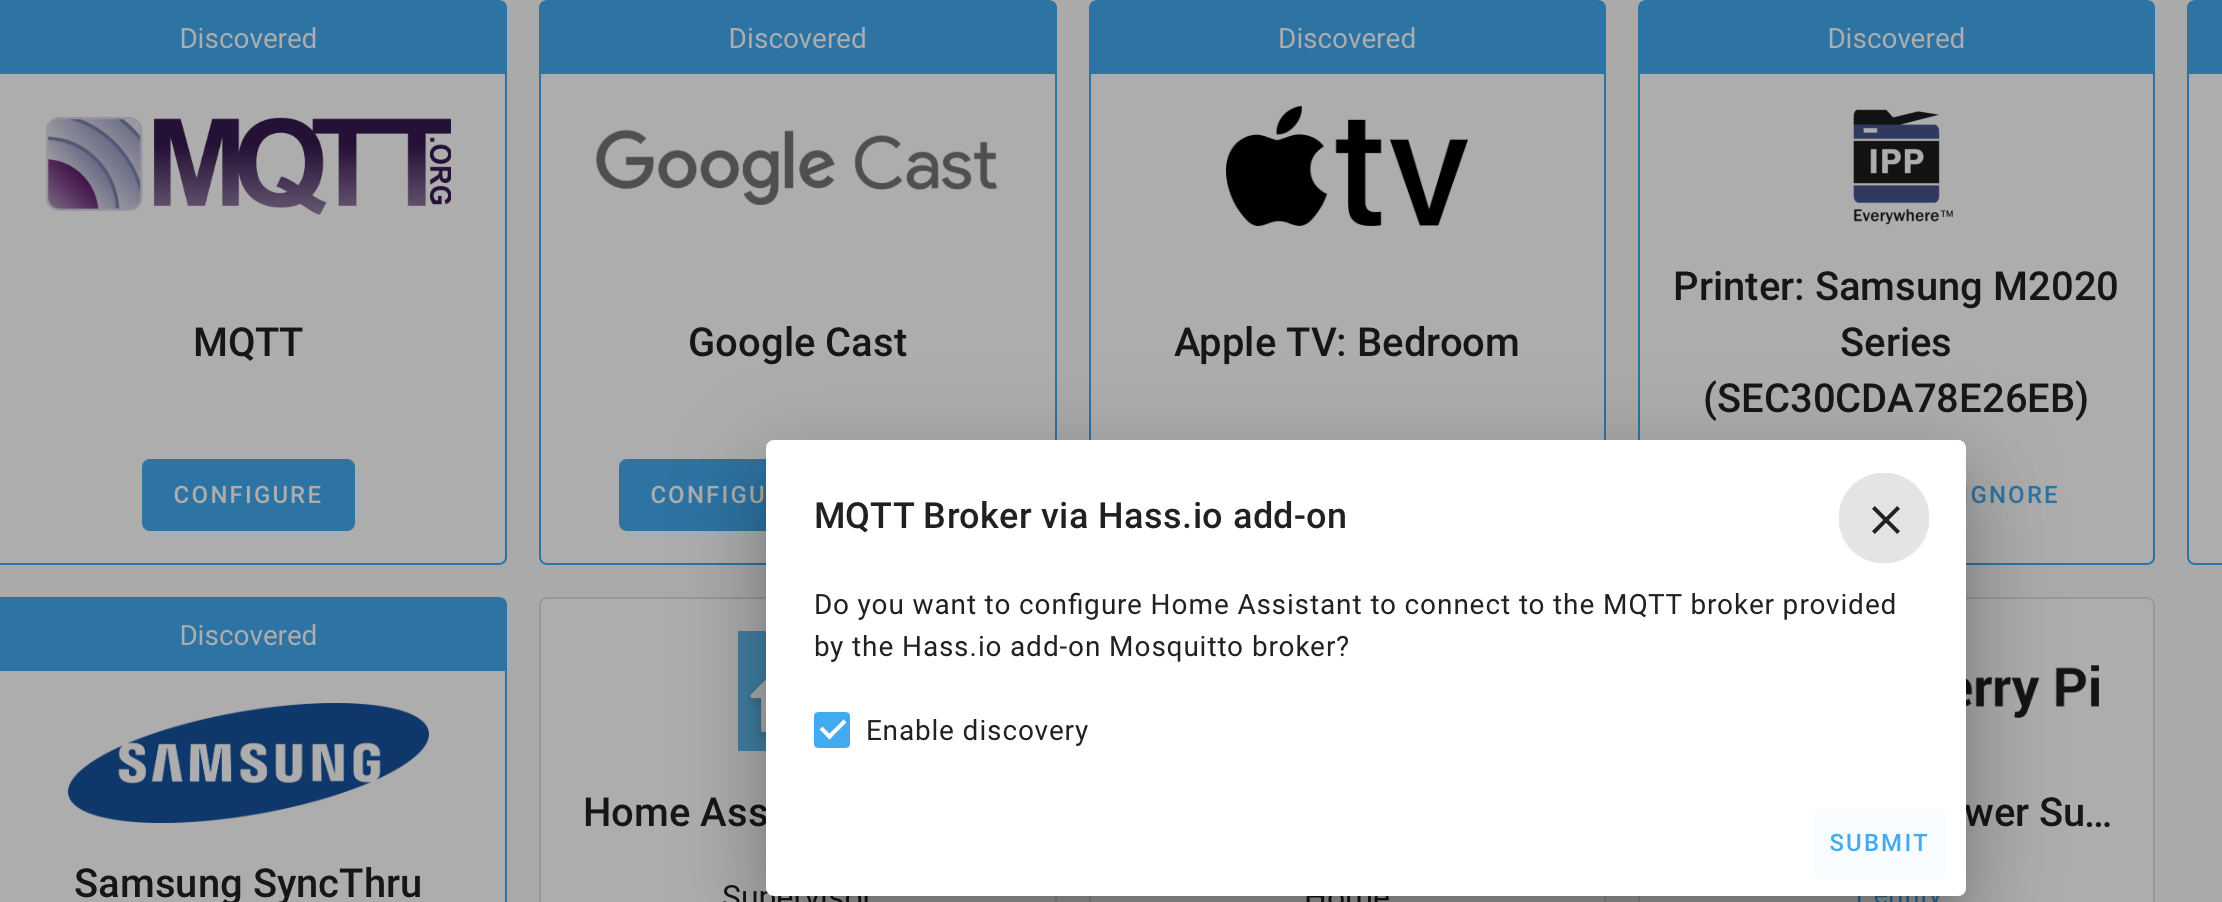
Now go to Configuration>>Integrations>>Click Configure in the MQTT block>>Click Submit in the popup window
trigBoard Setup
Launch the configurator as you normally would when setting up the trigBoard - hold wake button until Blue LED is flashing. Can go here for reference on all parameters: Configurator Tool
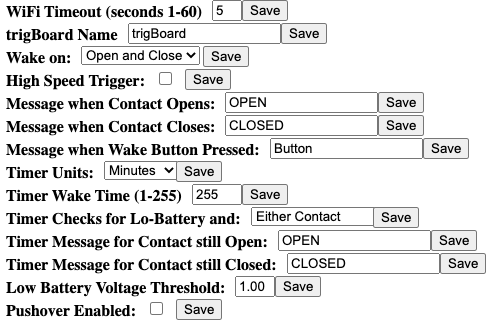
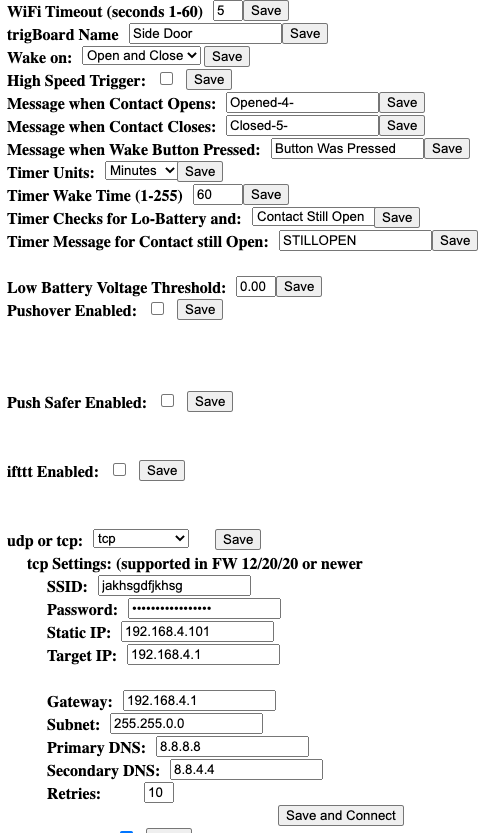
Setup the WiFi network settings first and make sure you get a connection, then setup the messages:
The only requirement here for all of your messages is that they contain no spaces or commas, because we’re going to use these characters for parsing on the Home Assistant side. Also, I recommend setting the battery threshold low, so that it never sends the low battery alert. Reason is because the low battery alert message would be a second packet for you to parse out… when really, you don’t need this alert since you will already have the ability to use the battery voltage to generate alerts within the Home Assistant system. If you have a trigBoard that rarely wakes and reports its status, but still want battery monitoring, you could set the timer to check if the contact is still open/closed and just set those messages to the same as your normal open and close messages like this:
or could use STILL_OPEN/CLOSED and just setup automations to detect these - that works too!

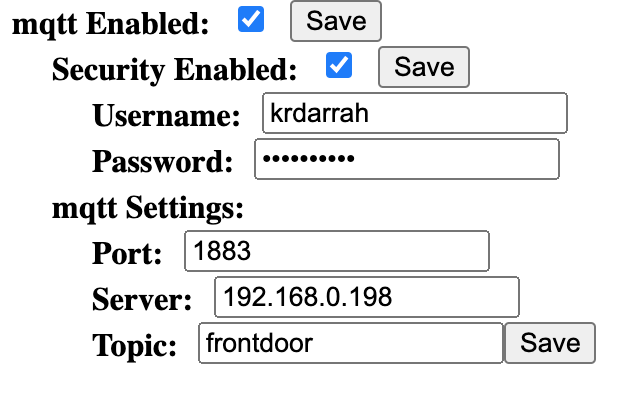
MQTT Settings
Home Assistant Yaml
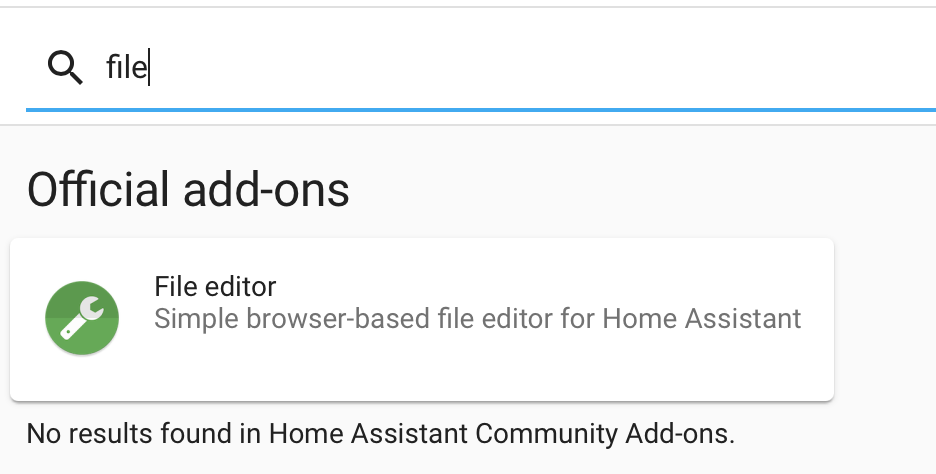
We’ll be using the File Editor to make changes to the configuration.yaml file, so go an install/start that just as shown above for Mosquitto
I like to keep this in the sidebar for quick access:

Launch the file editor and make you are editing the configuration.yaml file:
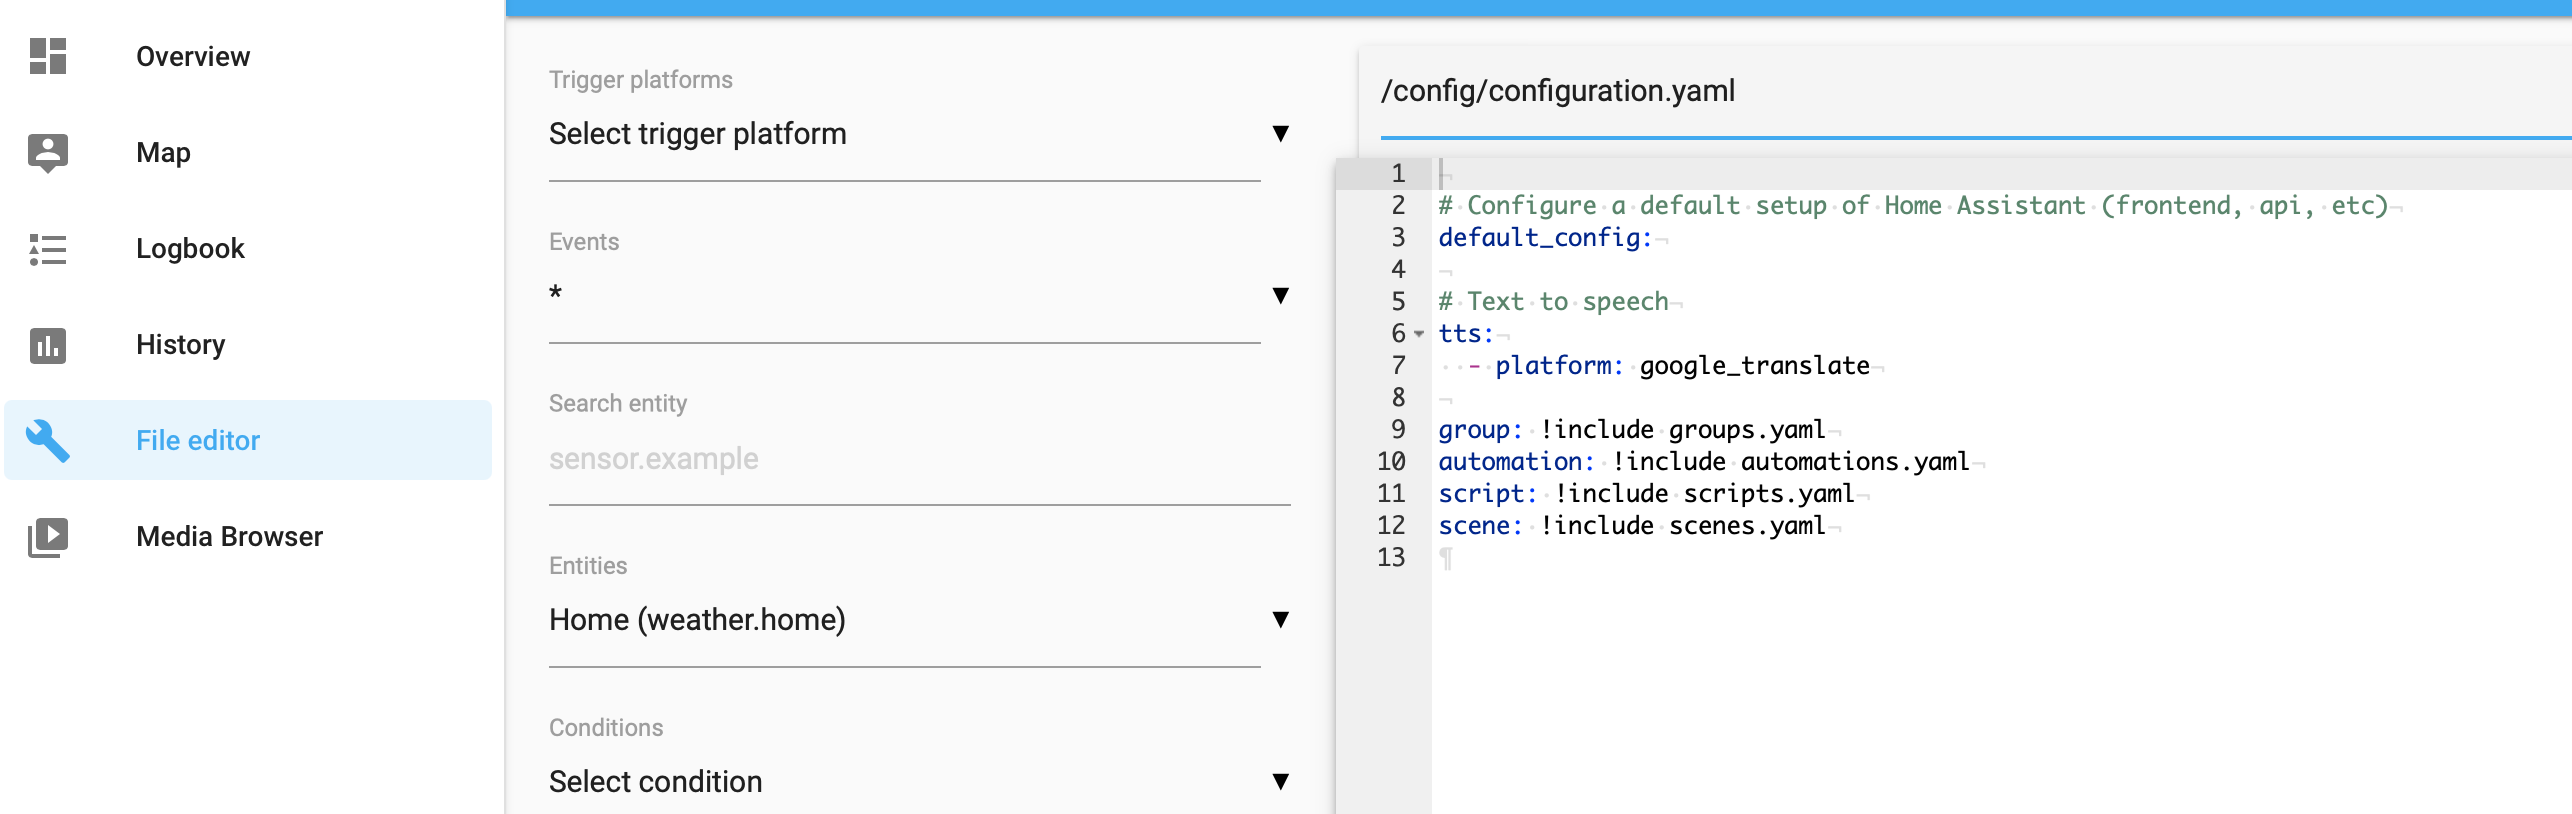
Here is where we’re going to add the trigBoards (more advanced users may keep this config elsewhere)
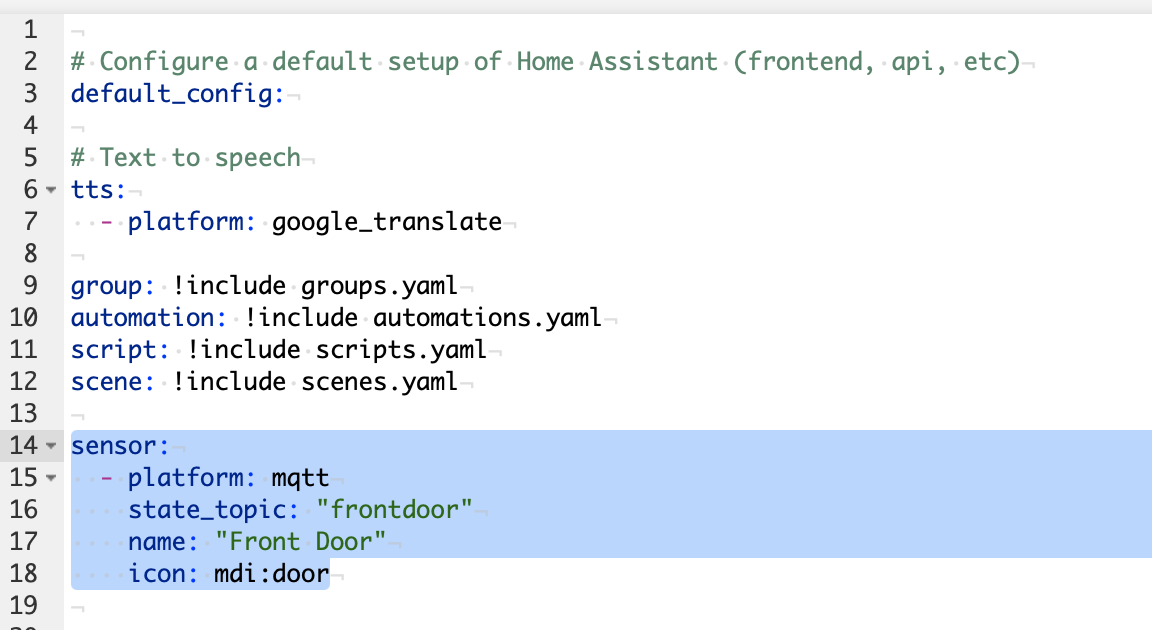
Let’s start by adding a sensor subscribed to that same topic we had set in the trigBoard Configurator:
sensor:
  - platform: mqtt
    state_topic: "frontdoor"
    name: "Front Door"
    icon: mdi:door
Which looks like this when you paste it in:
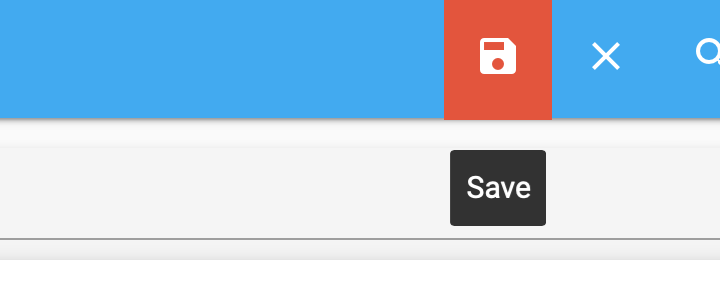
Save that:
Go to Configuration>>Server Controls>>Check Configuration
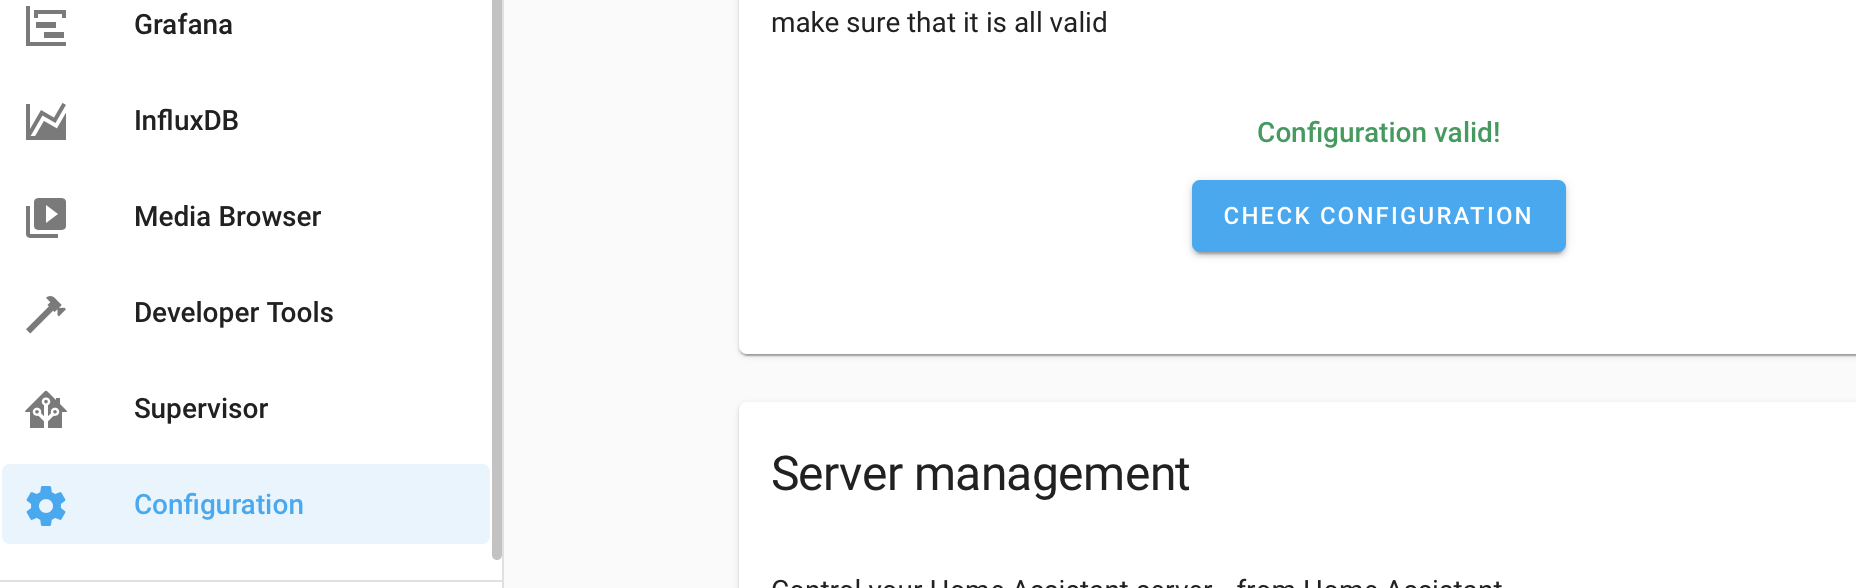
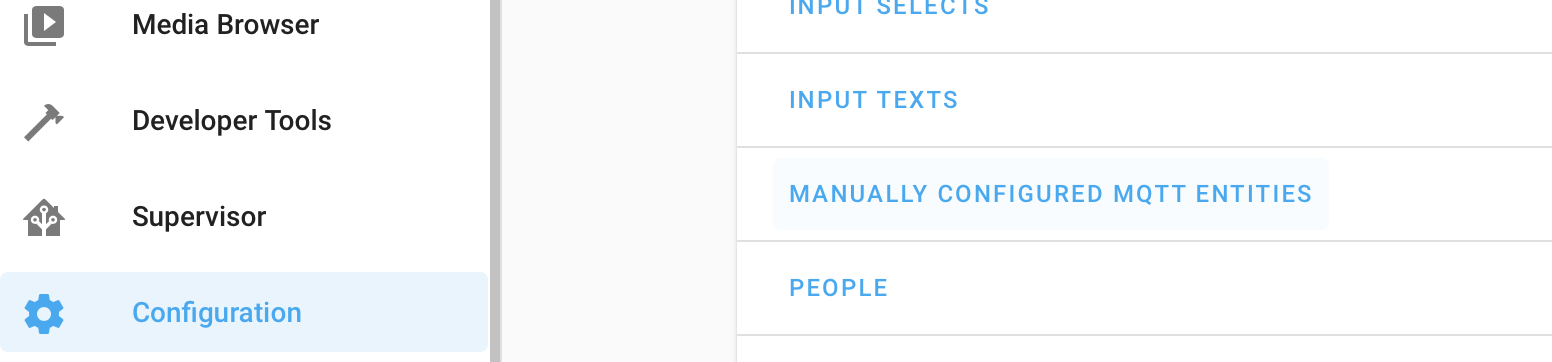
If all good, you can scroll down a bit and click “MANUALLY CONFIGURED MQTT ENTRIES”
Testing
Let’s make sure you see the trigBoard - Developer Tools>>**STATES** and look for your newly created entity:
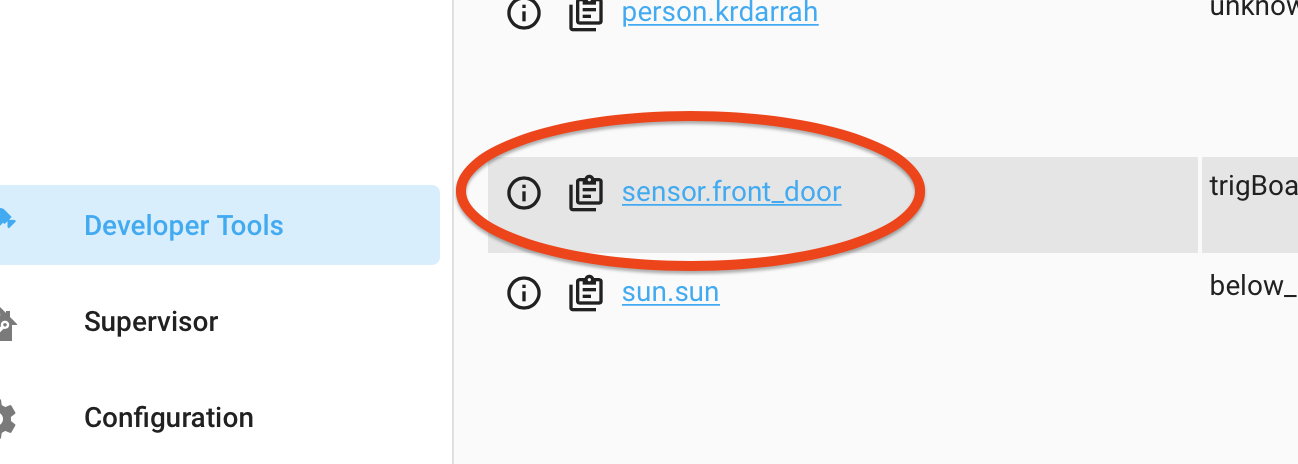
If you look at its state while opening/closing the contact, you should see the normal trigBoard message.
Parsing
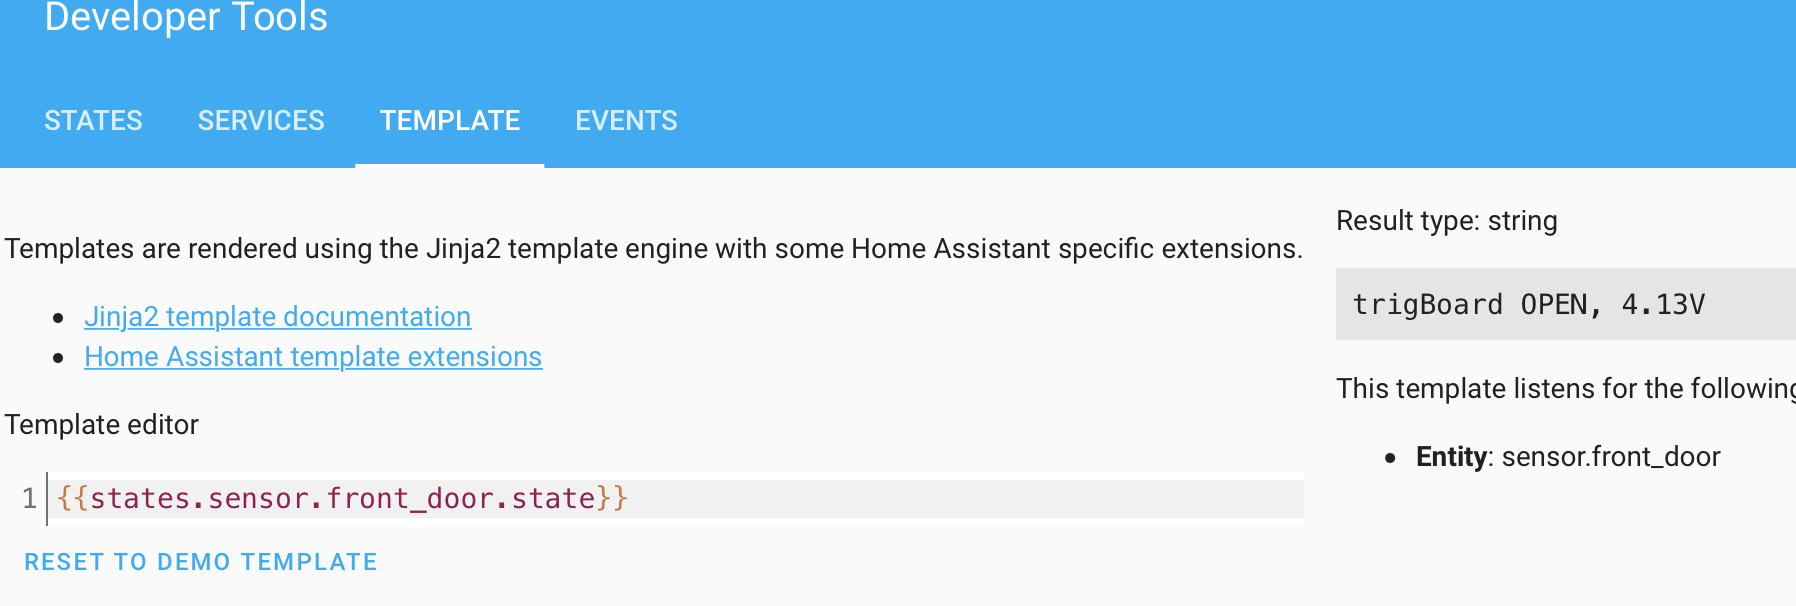
Within the Developer Tools, go to the TEMPLATE tab:
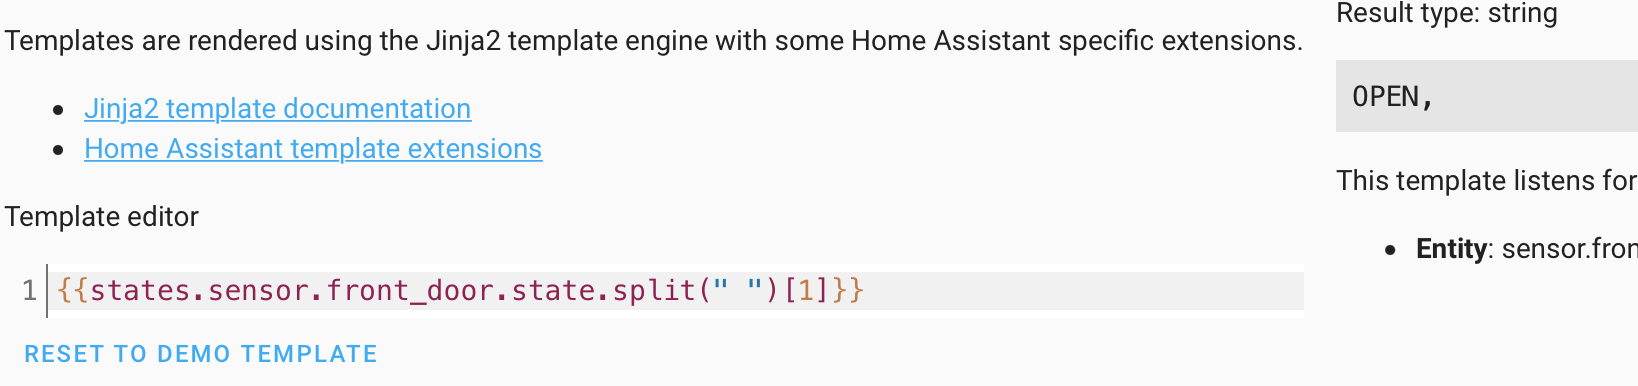
Here we can experiment with parsing, first just to look at the raw message:
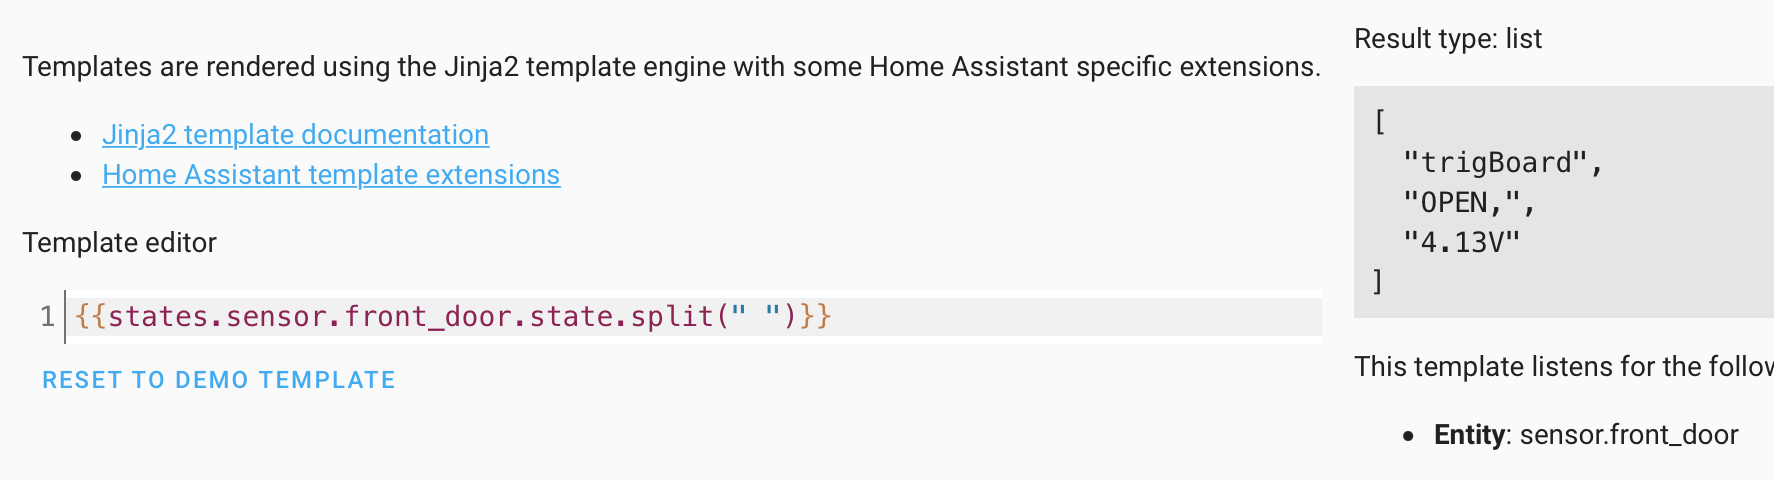
If we split by the space character:
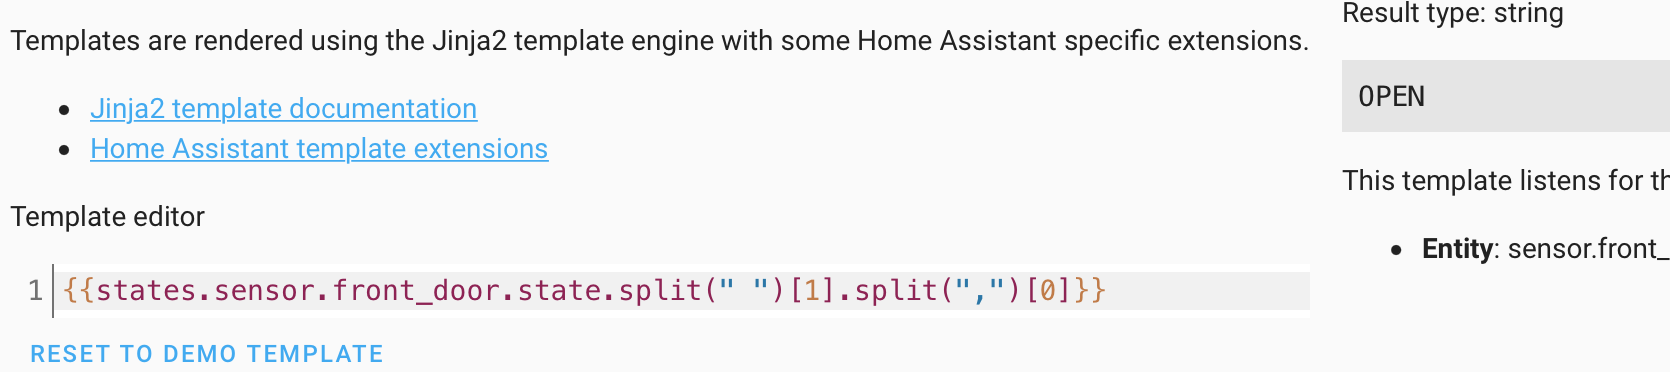
Now we can select the part of the message we want:
And we can split again to get rid of that comma:
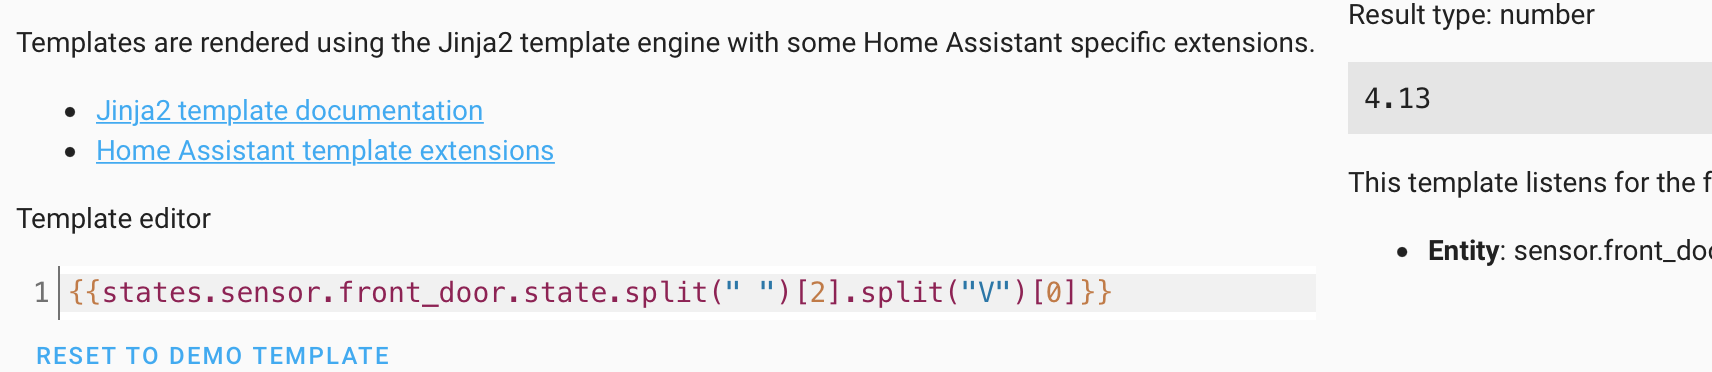
And we can the same thing to get the voltage and strip out the unit:
Final Config
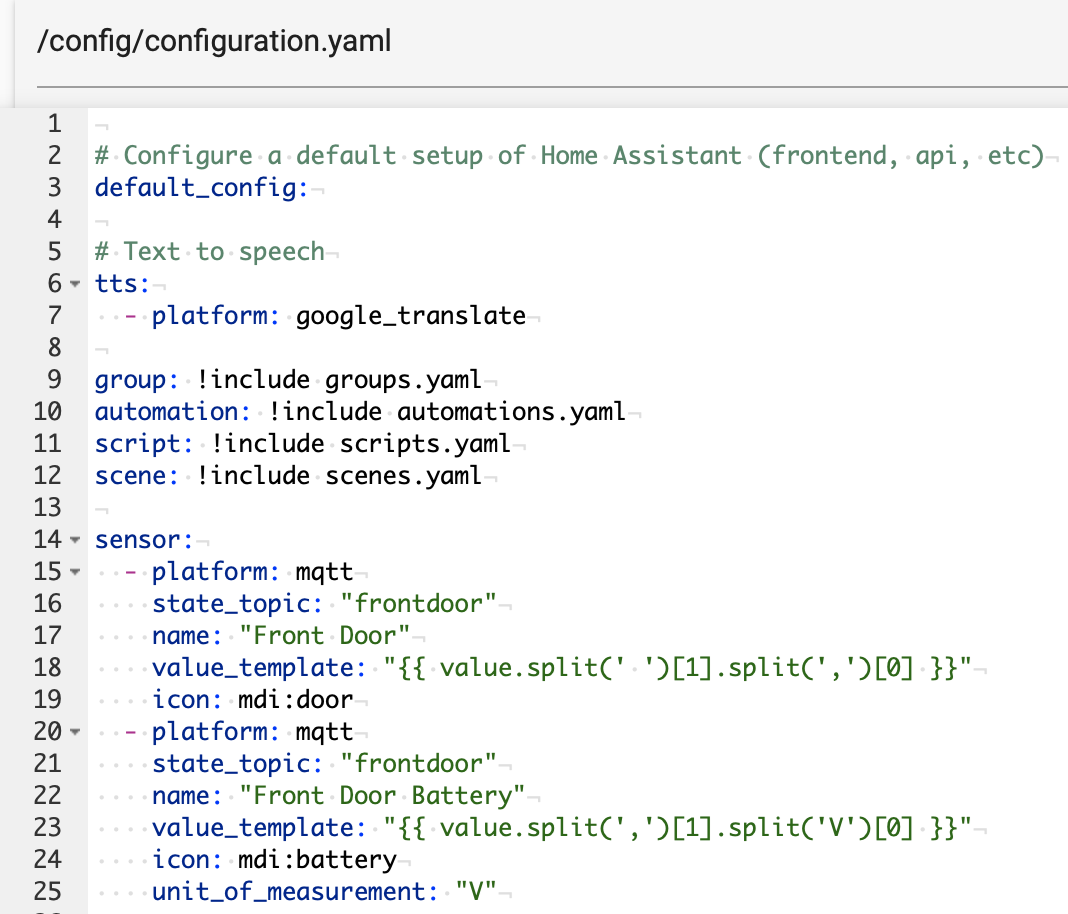
With this knowledge, we can use a value_template in the YAML file to automatically pull this information out of the trigBoard message. We need to create two sensors for both status and voltage. Note that you can add a custom MDI Icon and give a unit:
sensor:
  - platform: mqtt
    state_topic: "frontdoor"
    name: "Front Door"
    value_template: "{{ value.split(' ')[1].split(',')[0] }}"
    icon: mdi:door
  - platform: mqtt
    state_topic: "frontdoor"
    name: "Front Door Battery"
    value_template: "{{ value.split(',')[1].split('V')[0] }}"
    icon: mdi:battery
    unit_of_measurement: "V"
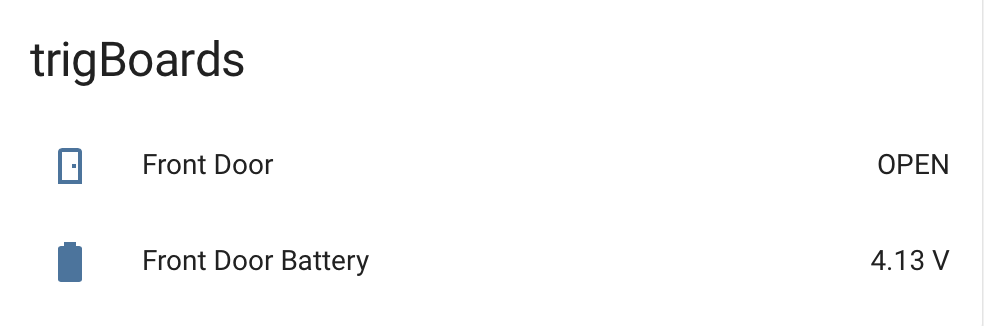
Which looks like this in the file:
Don’t forget to save and reload MQTT entries!
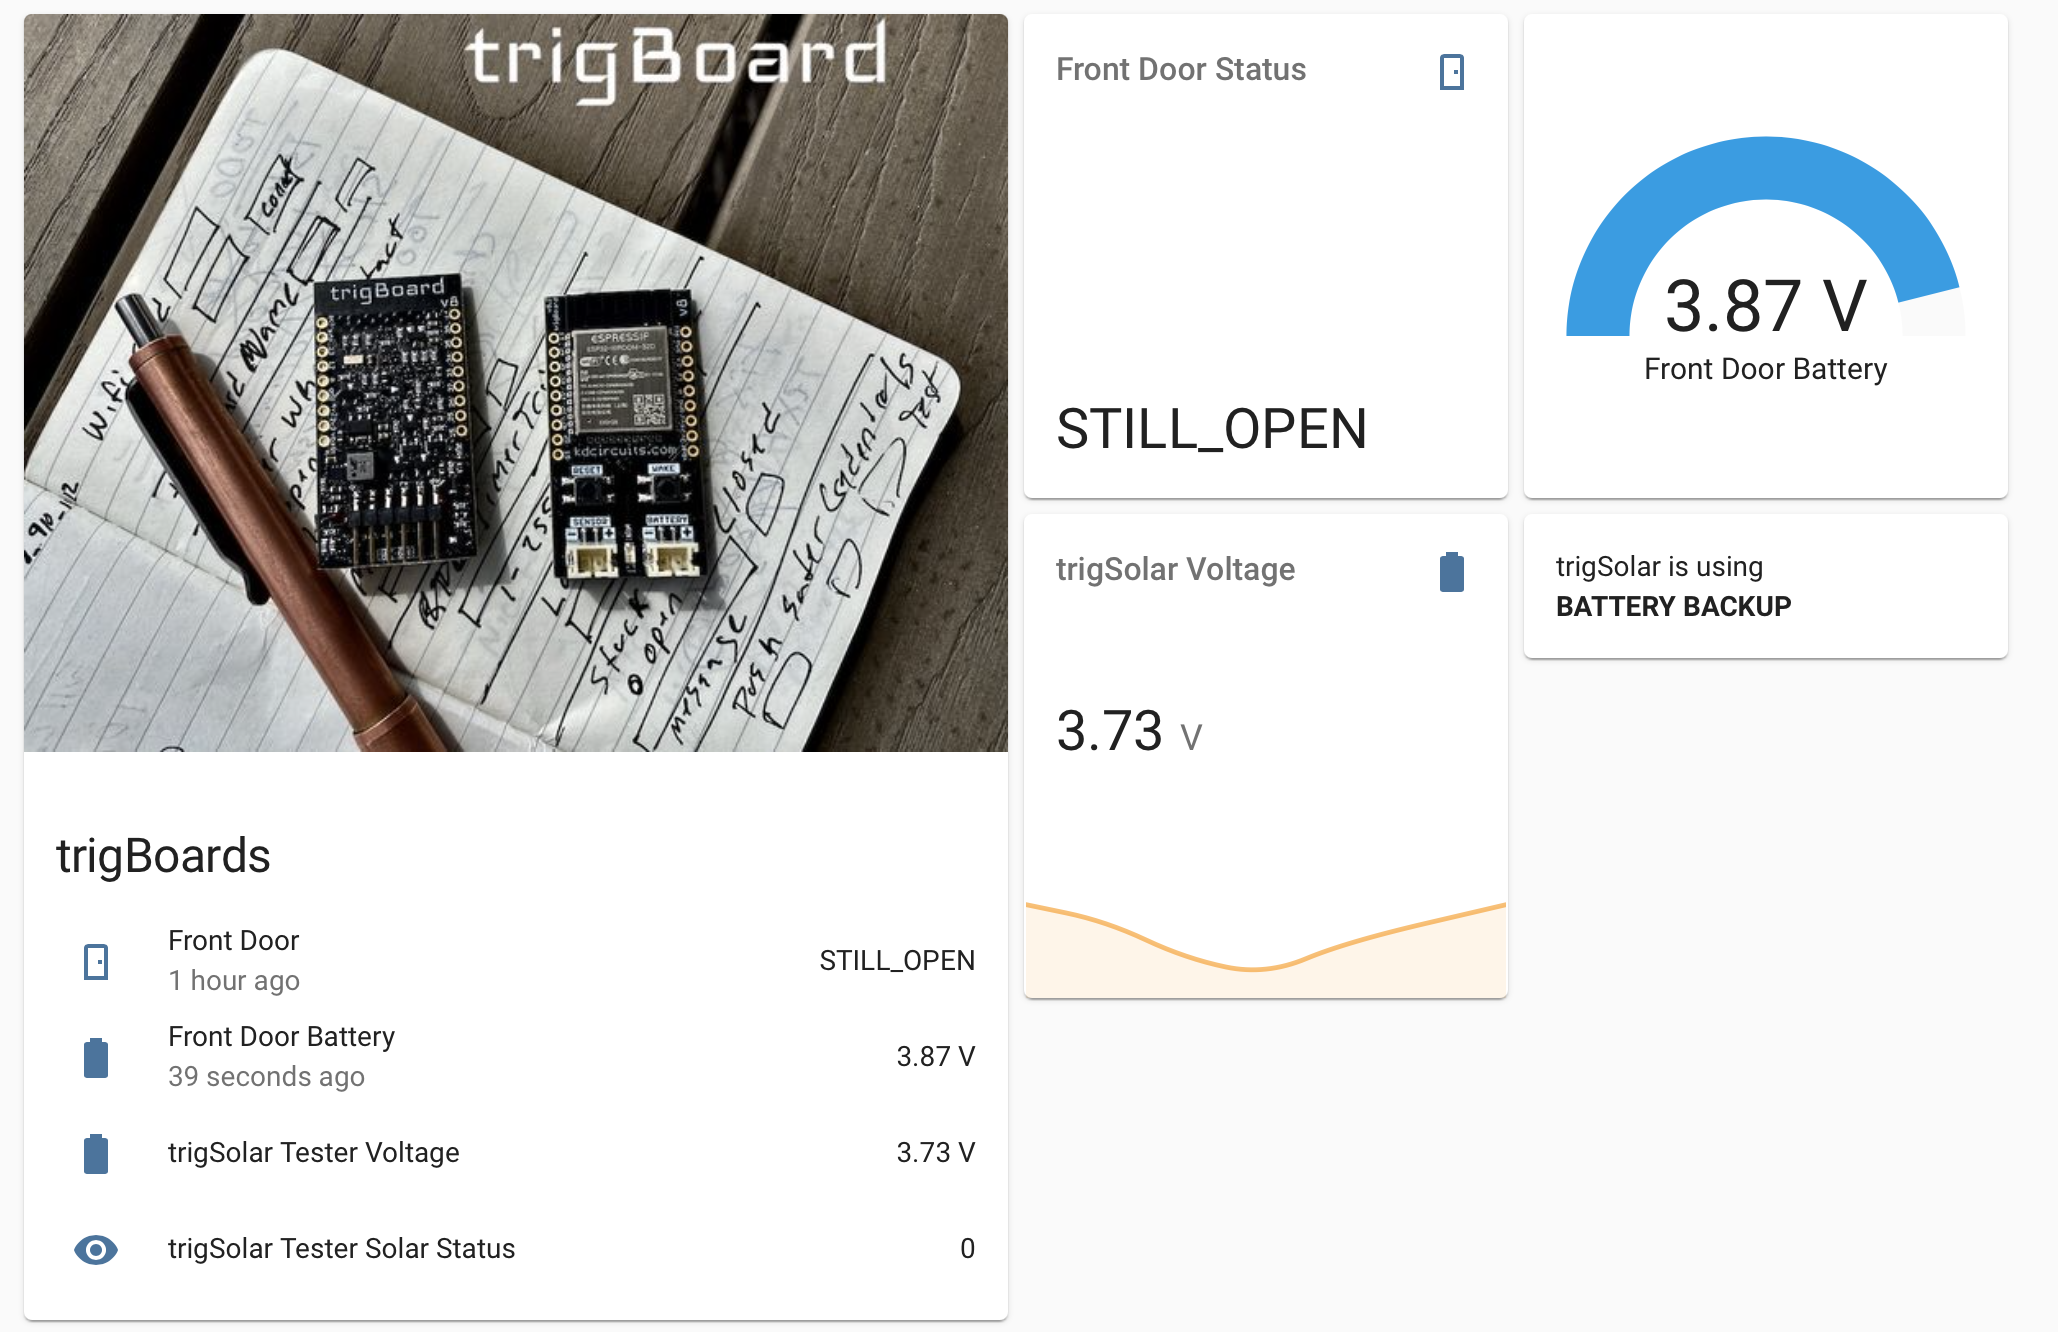
Now you’re all set - head over to Overview and click the 3 dots in the upper right to edit your dashboard. Go ahead an take control of the Lovelace UI, then create an Entity Card and you should be able to add in the trigBoard:
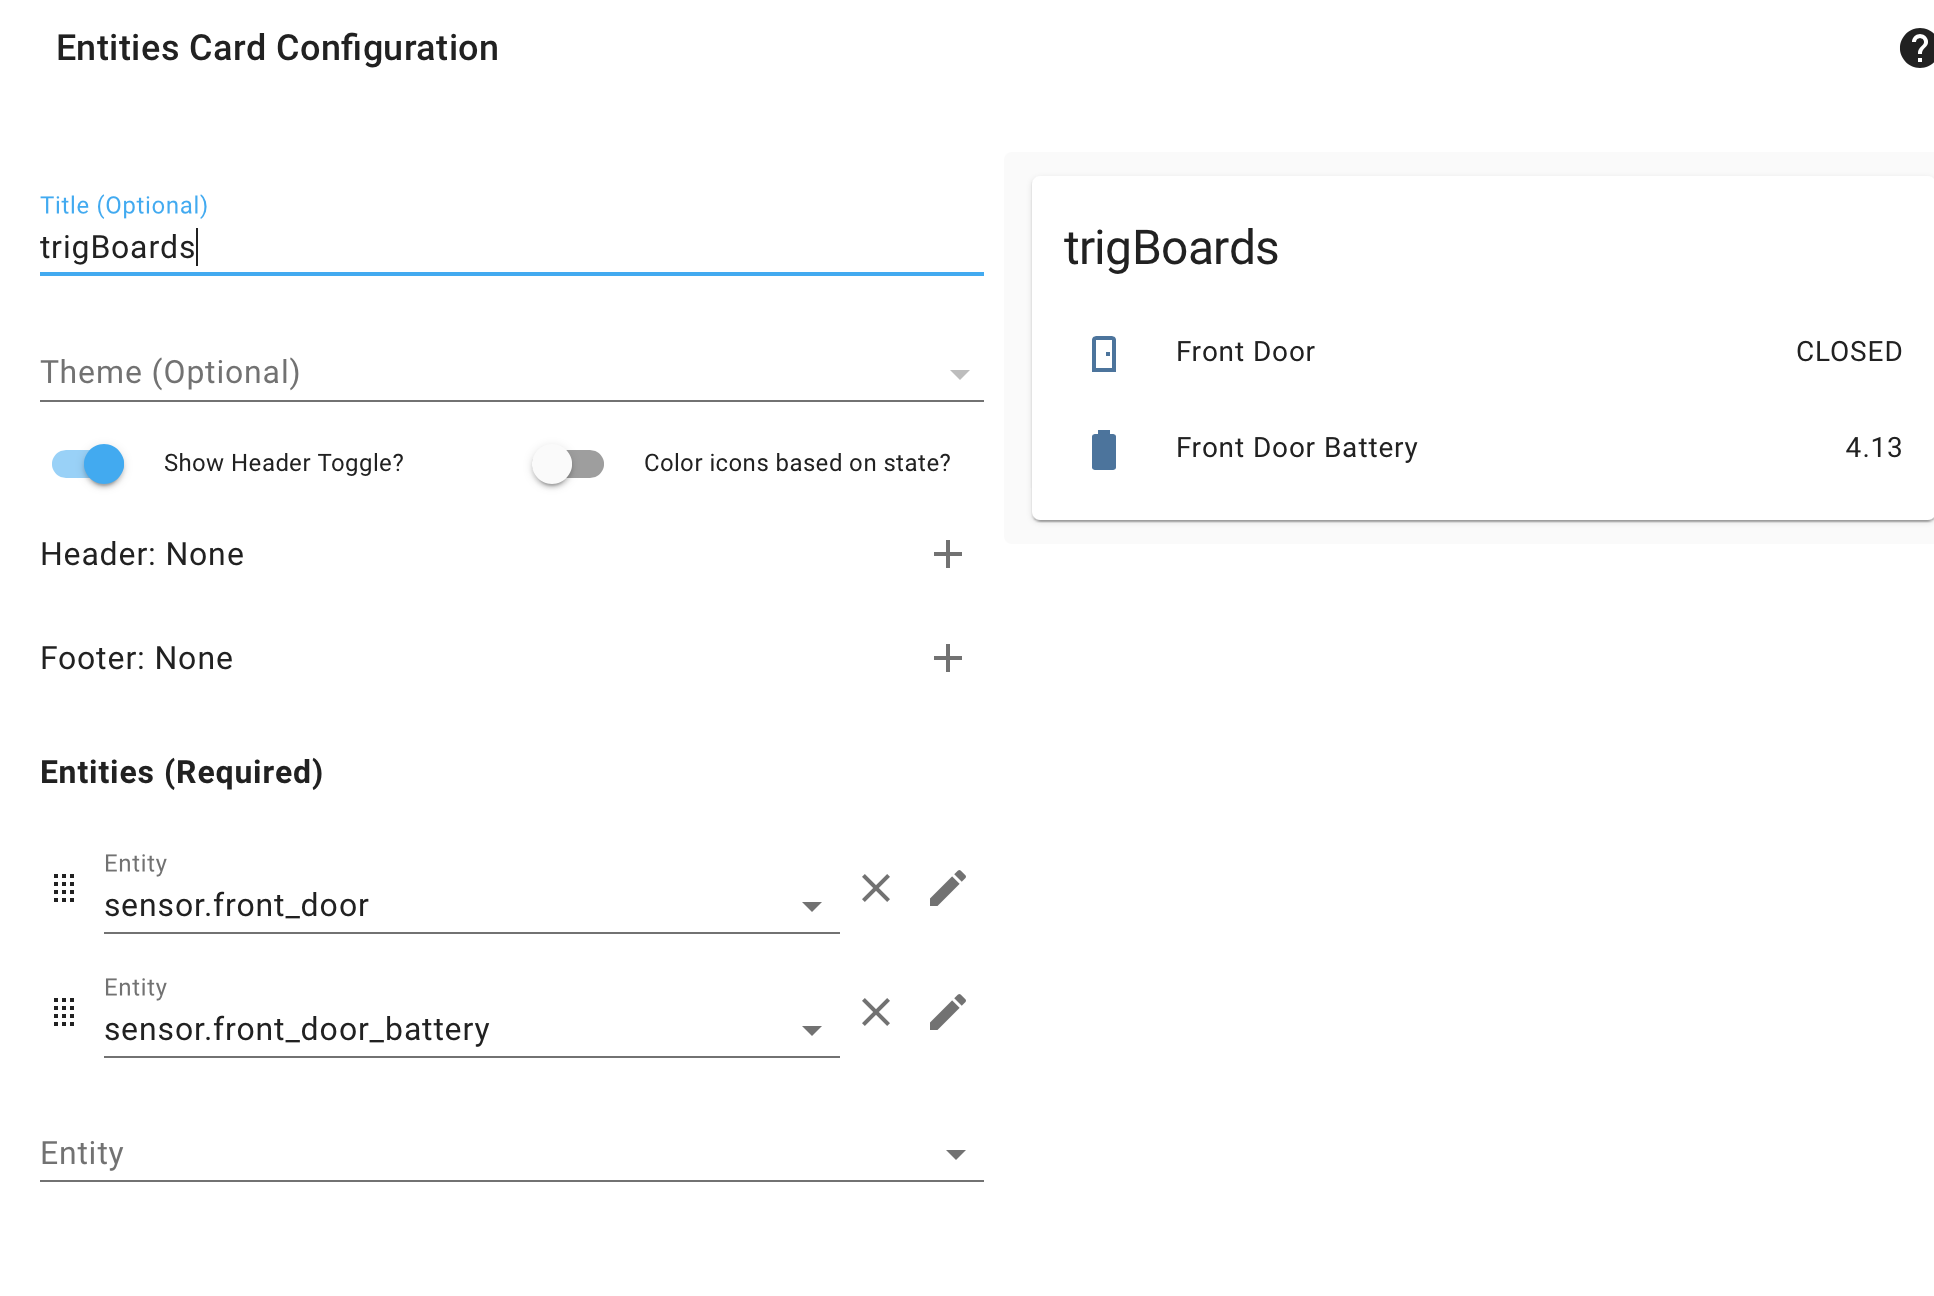
And now you have a trigBoard in your dashboard!
With these entities, you can go nuts with this! Create conditional cards to show custom text when these states change, automations to run actions based on events (even have your Alexa/Google speak!), or really anything you want from here!
Custom Sensors
Want to add a temperature sensor to the trigBoard? Maybe report status of something along with the message? This is very EASY
First step is to make sure you can compile/upload the Base Firmware
The key is to just concat the data onto the existing message - here is a snippet from a sensor I have that samples a GPIO pin:
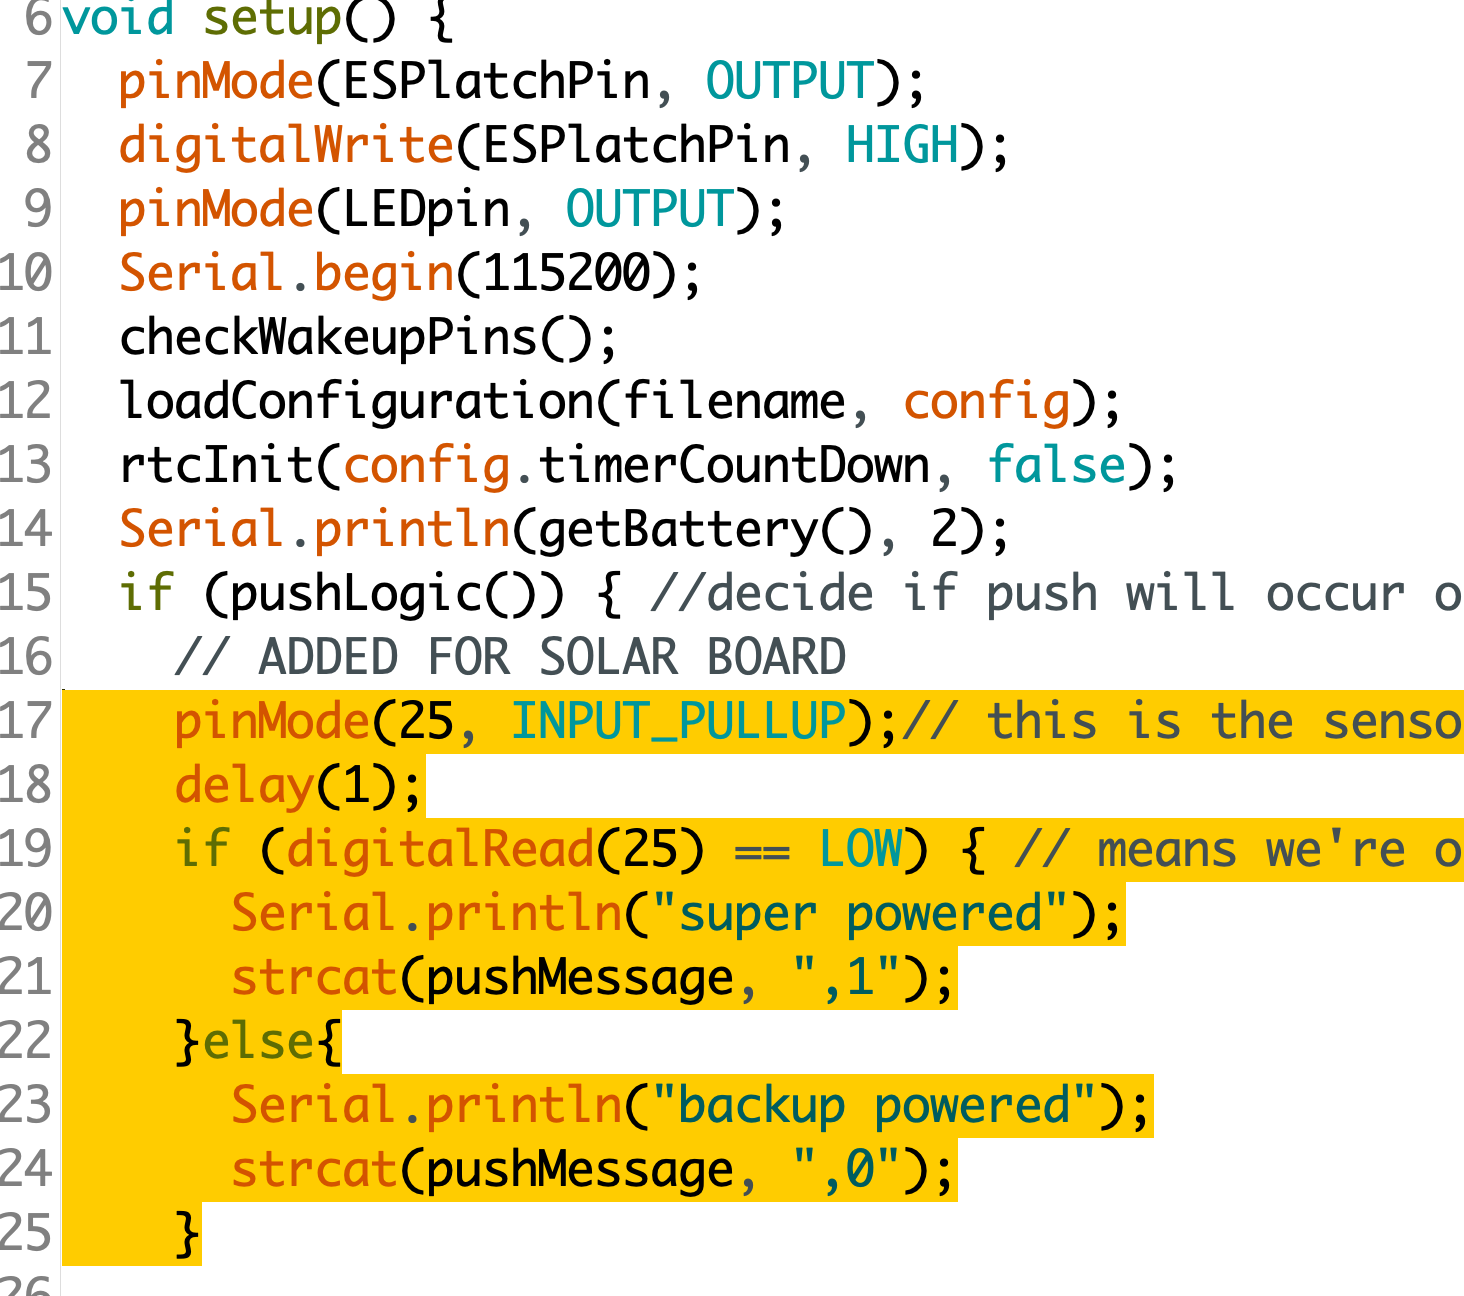
You see how it’s just a comma separated value added to the end of the push message? That’s all you need, since this is super easy to then pull out from the value_template, like in this case I only needed battery voltage and this new value for state:
sensor:
    state_topic: "trigSolarTester"
    name: "trigSolar Voltage"
    icon: mdi:car-battery
    unit_of_measurement: "V"
    value_template: "{{ value.split(',')[1].split('V')[0] }}"

  - platform: mqtt
    state_topic: "trigSolarTester"
    name: "trigSolar State"
    icon: mdi:solar-power
    unit_of_measurement: "V"
    value_template: "{{ value.split(',')[2] }}"
Or here’s another example adding a temperature value:
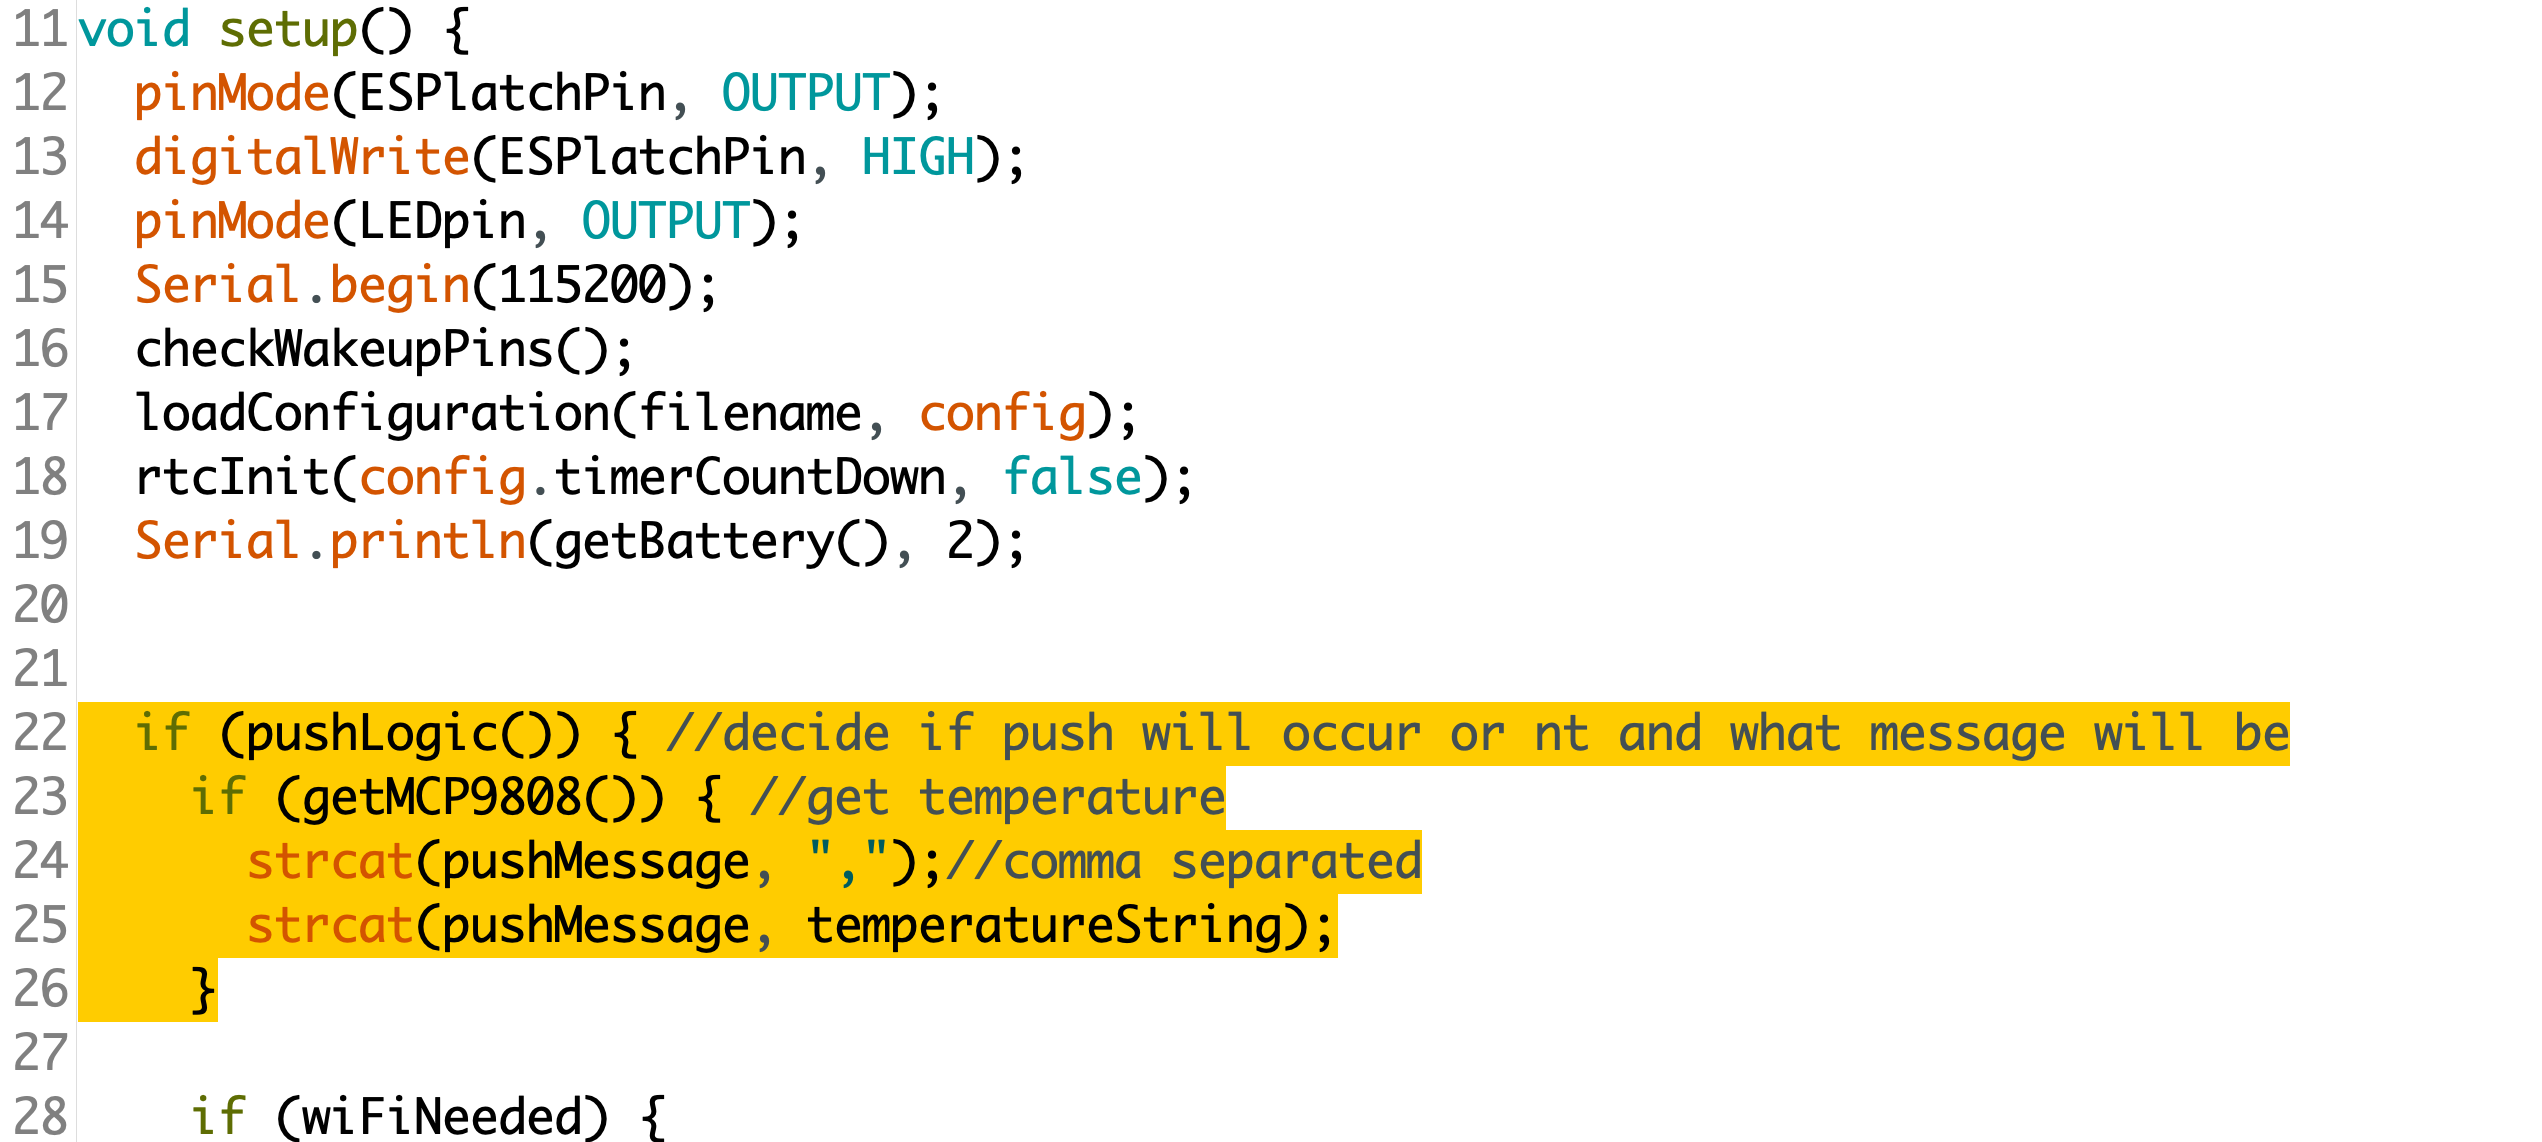
And same as before, this sensor is on a timer and wakes every minute to send data - I only care about voltage and this new temperature value:
sensor:
  - platform: mqtt
    state_topic: "MCP9808_OUTSIDE"
    name: "Back Porch Temperature"
    icon: mdi:temperature-fahrenheit
    unit_of_measurement: "F"
    value_template: "{{ value.split(',')[2] }}"

  - platform: mqtt
    state_topic: "MCP9808_OUTSIDE"
    name: "Back Porch TempSensor Voltage"
    icon: mdi:car-battery
    unit_of_measurement: "V"
    value_template: "{{ value.split(',')[1].split('V')[0] }}"
Plotting with Grafana+InfluxDB
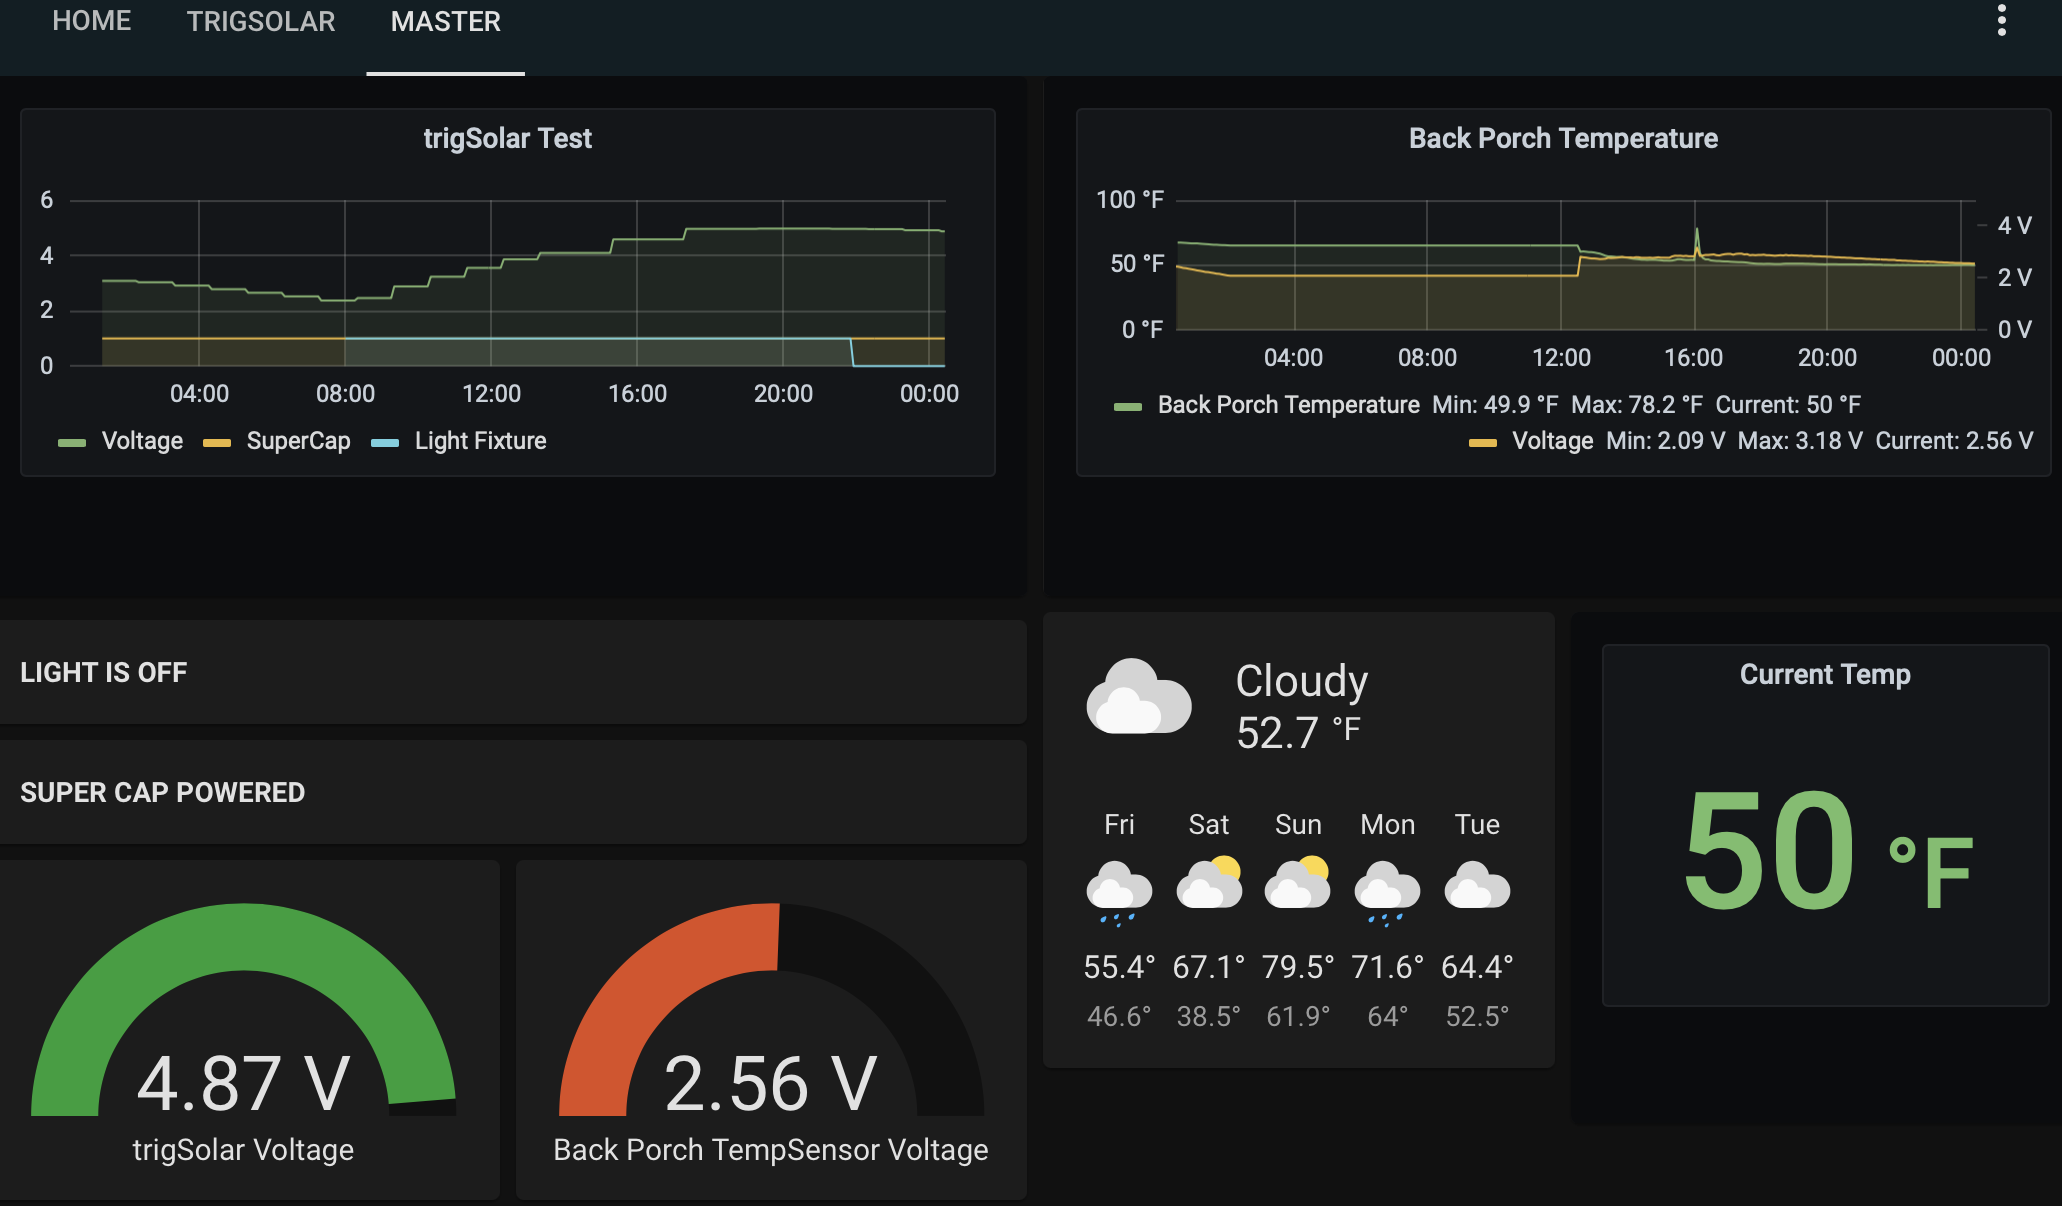
This takes plotting your data to the next level - just look at this dashboard I created:
Install InfluxDB
Same as before: Supervisor>>Add-on Store, then search for InfluxDB Go ahead and install/start that:
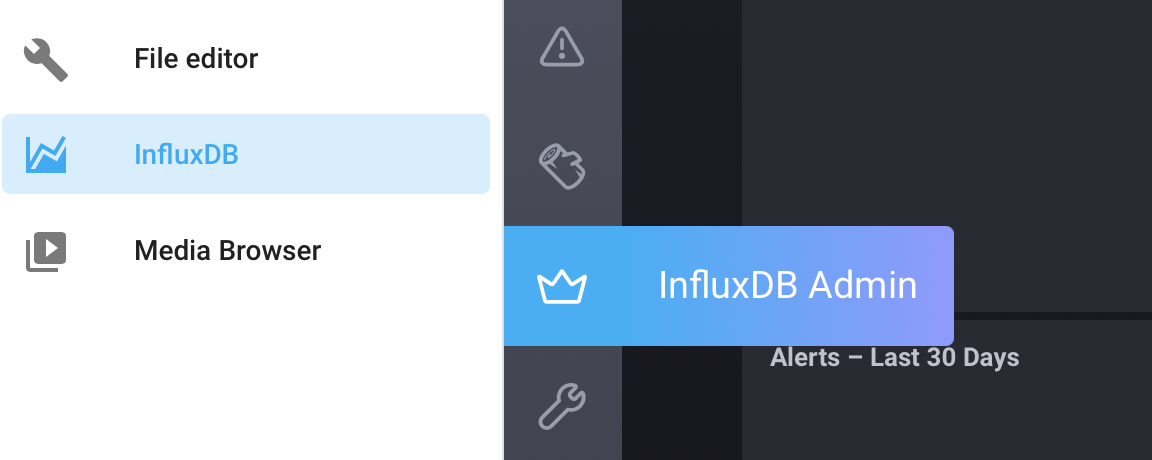
Once started, go into InfluxDB and click the InfluxDB Admin icon:
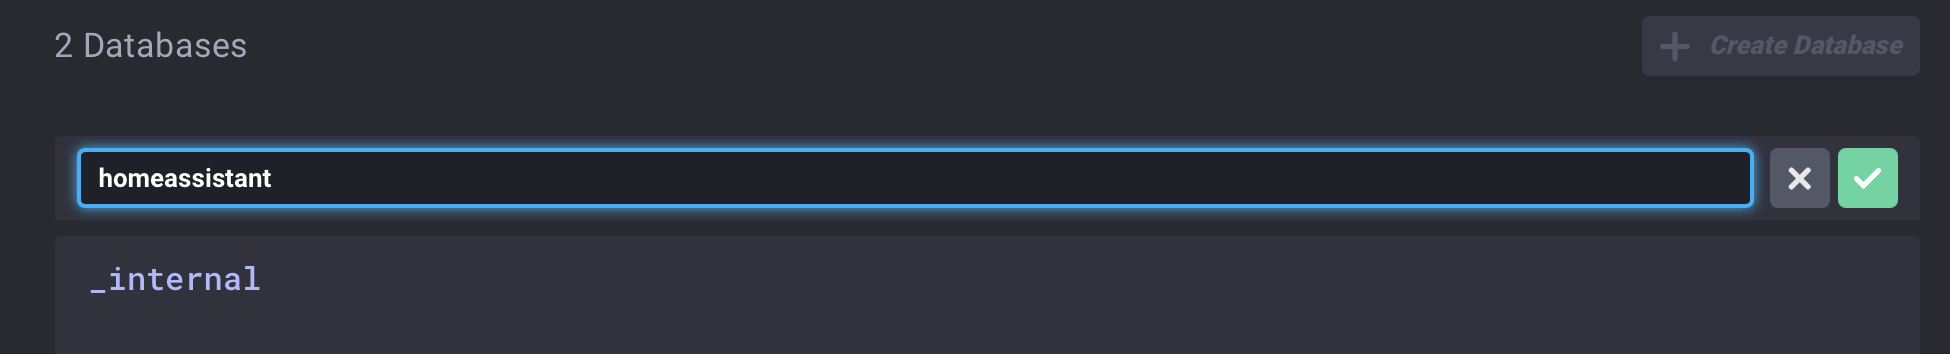
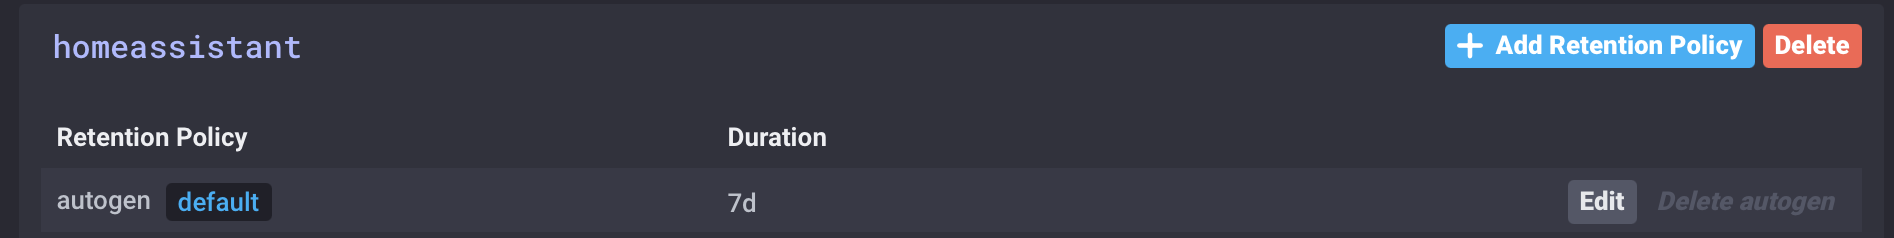
Create a new database and call it homeassistant
I changed my duration to 7d
Click on Users and create a new user called homeassistant and choose a password:
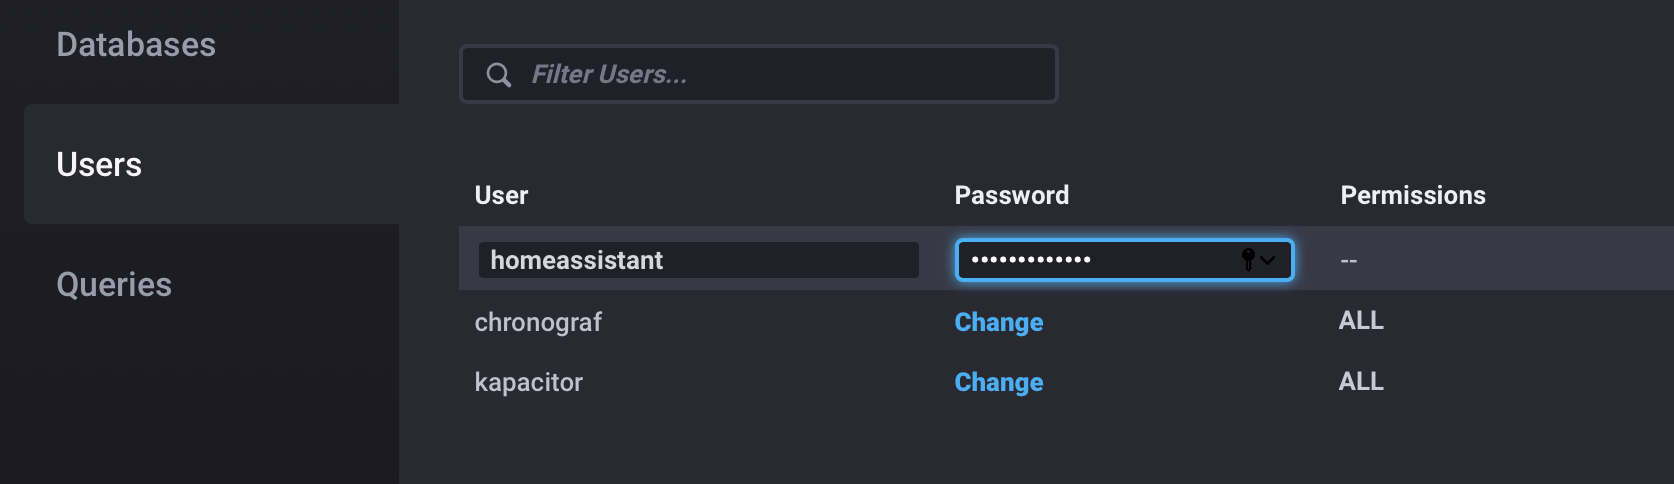
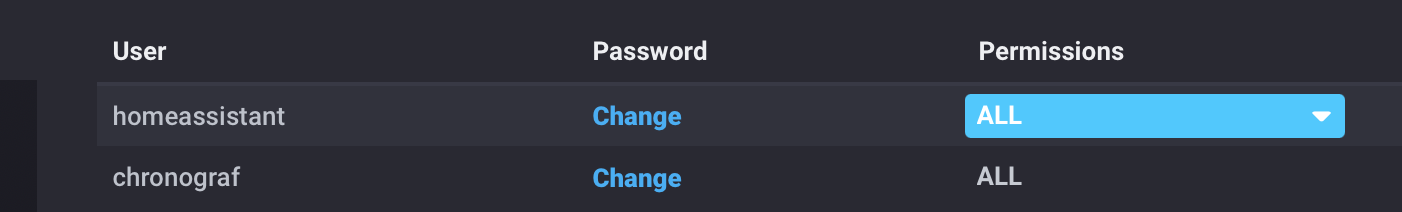
Don’t forget to change the permissions to ALL
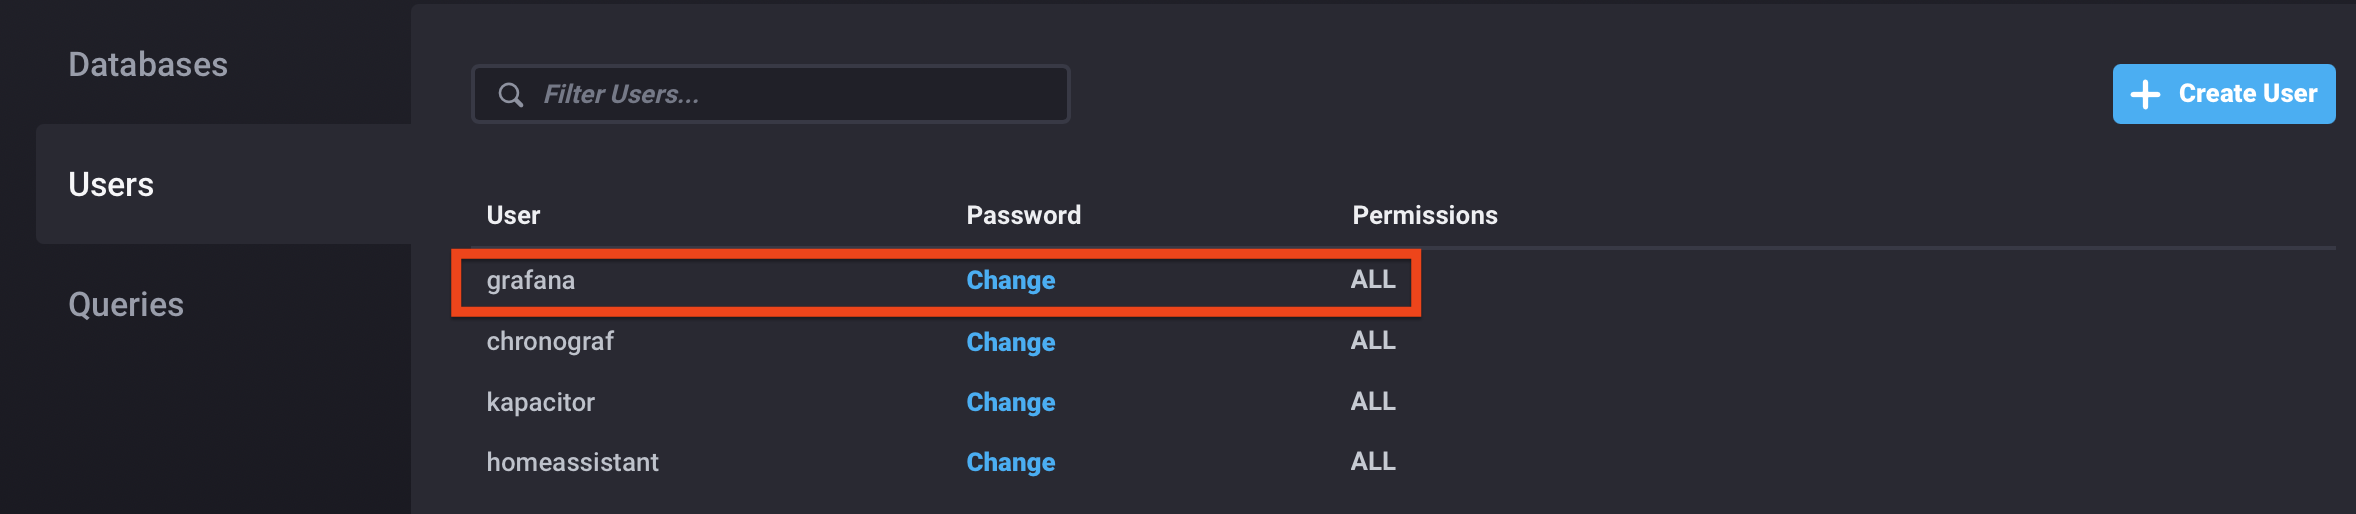
While we’re in here, add a user for Grafana as well and also give ALL permissions:
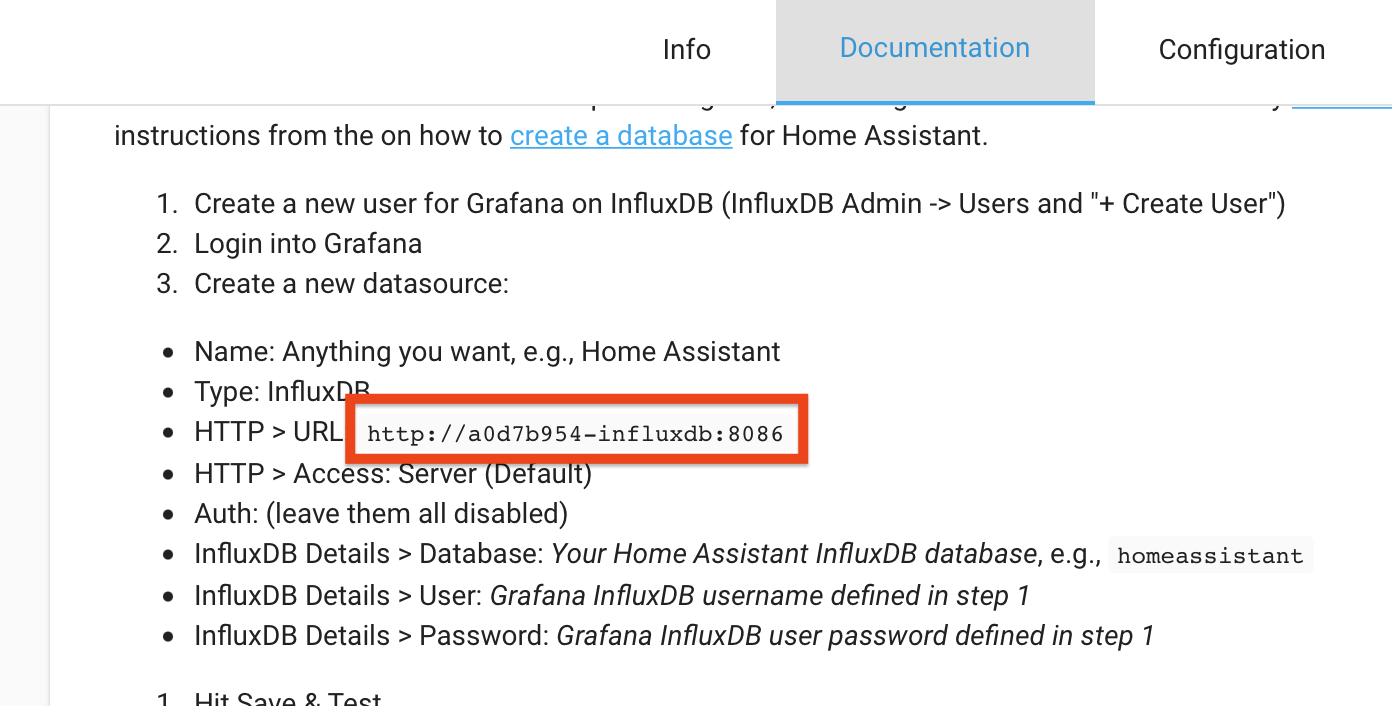
Go back to Supervisor and select InfluxDB and click the Documentation tab - scroll down a bit to the Yaml snippet - COPY this:
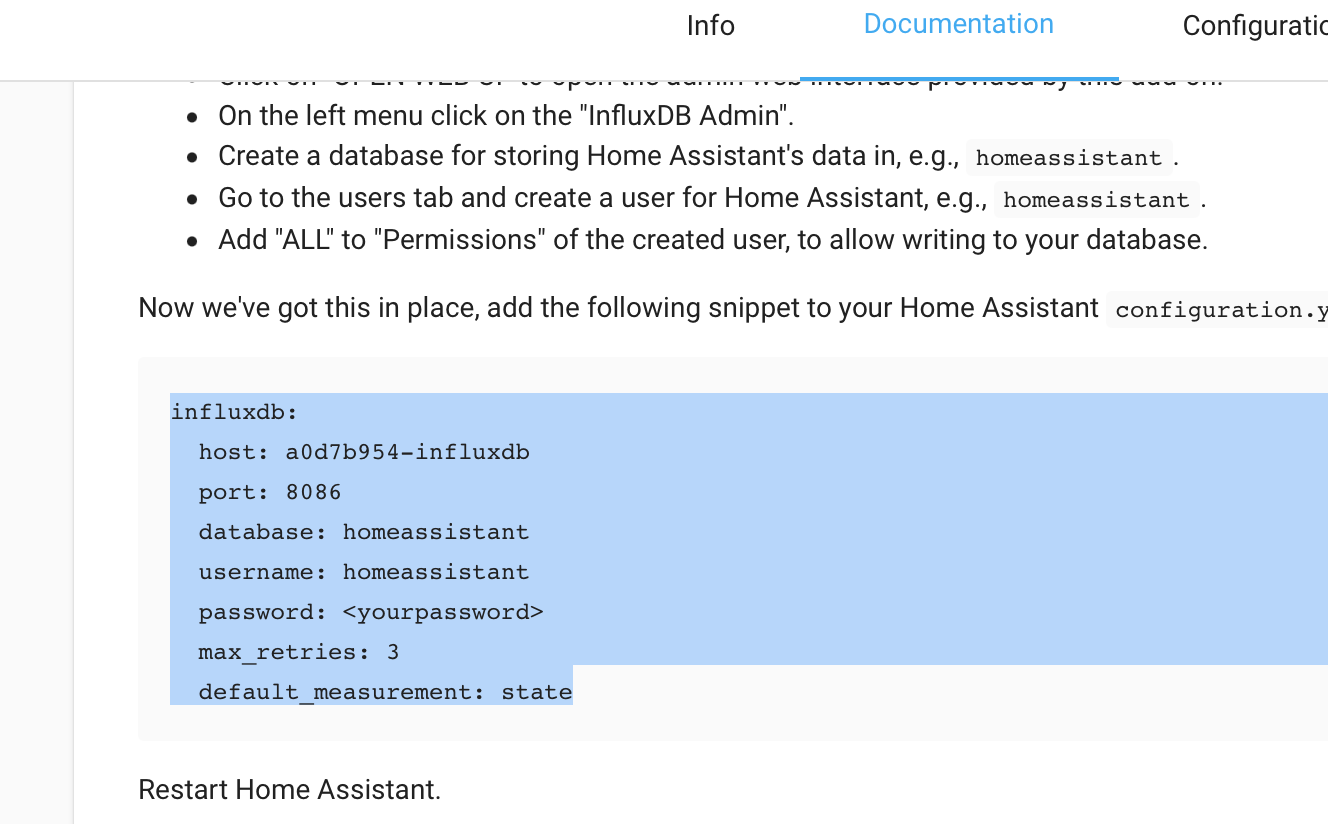
Head back over to your file editor to modify your configuration.yaml file and paste this in there, but note that the database name, user, and password all match up with what we have created in the InfluxDB admin page:
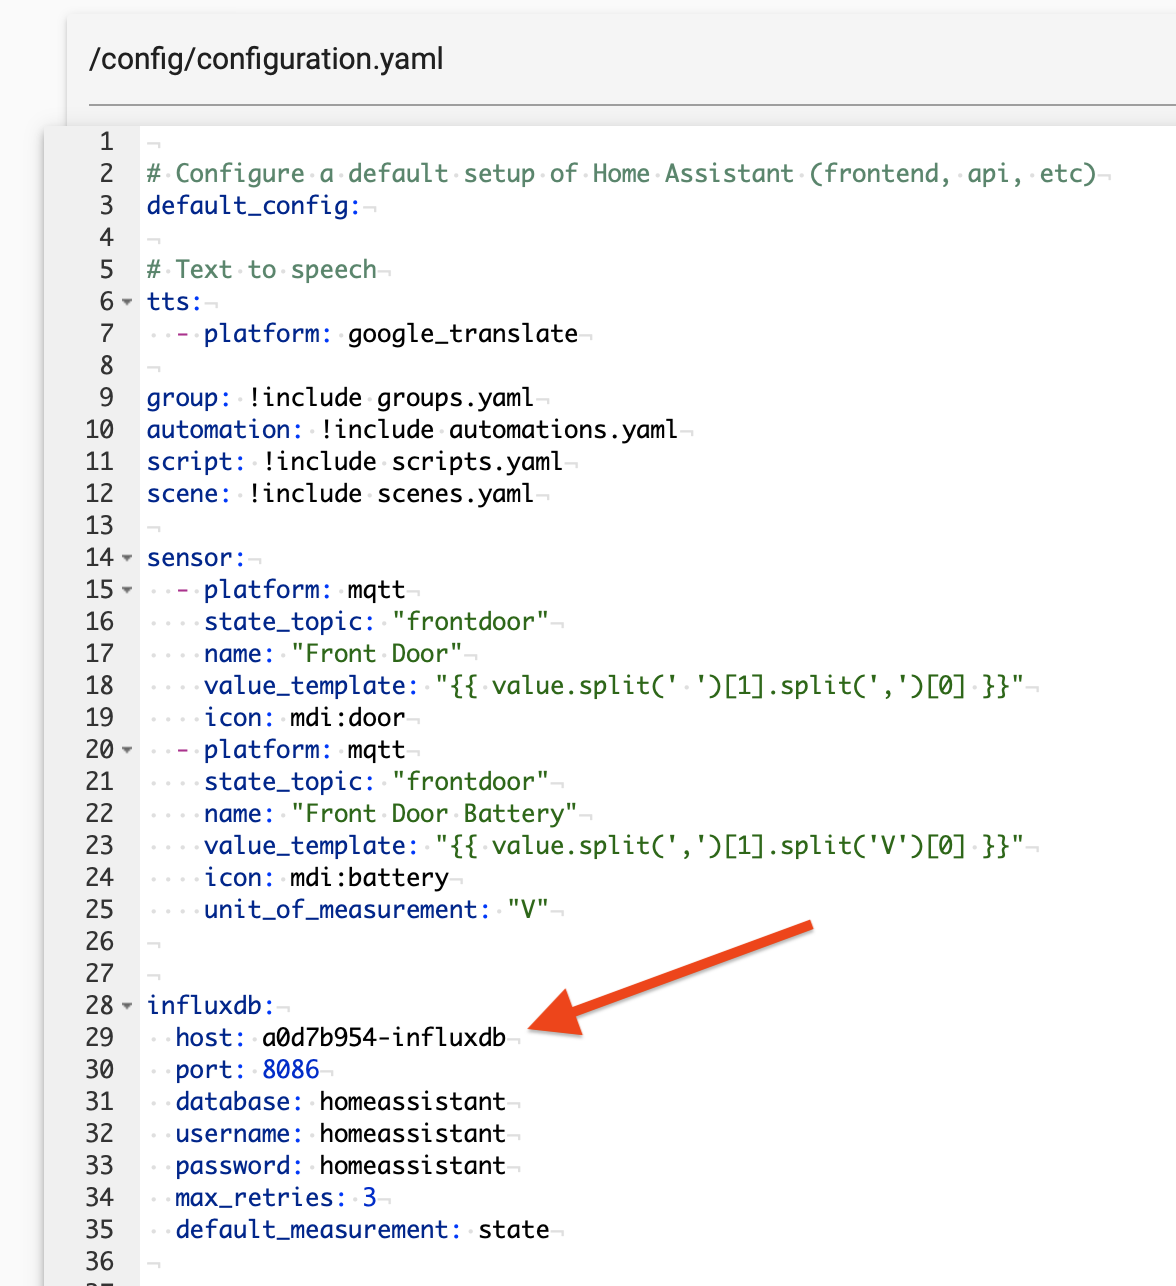
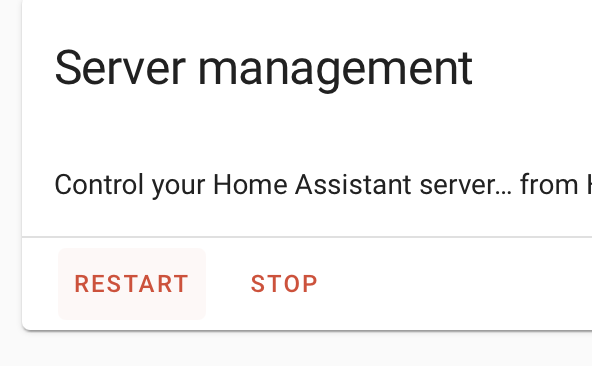
Finally, give your Home Assistant a restart: Configuration>>Server Controls and click RESTART
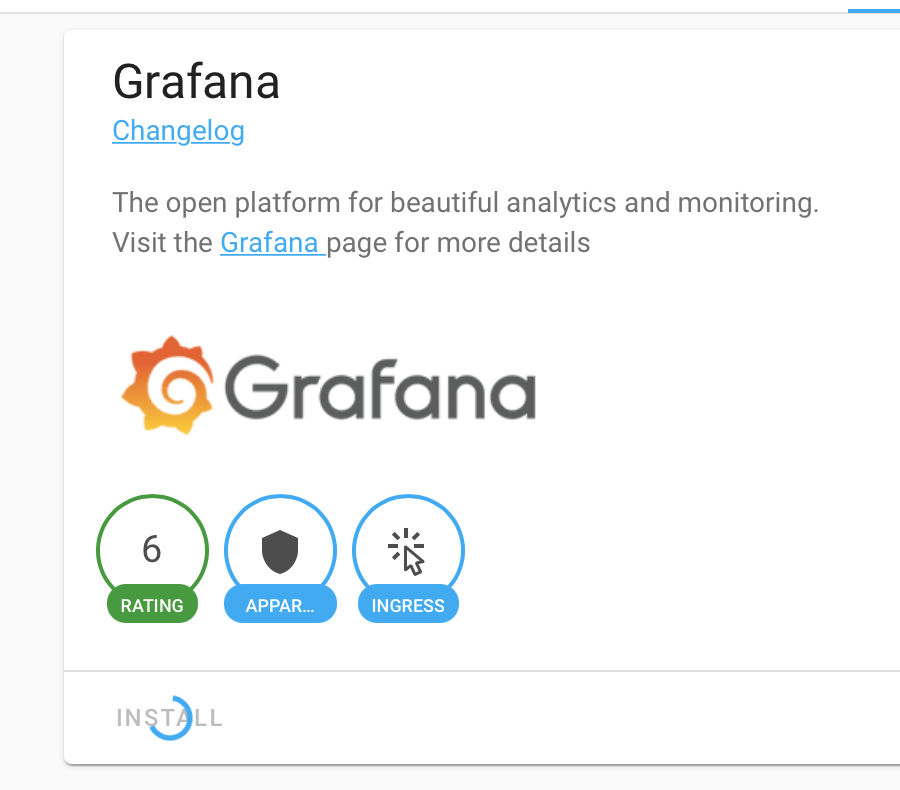
Install Grafana
Supervisor>>Add-on Store, then search for Grafana Go ahead and install/start that:
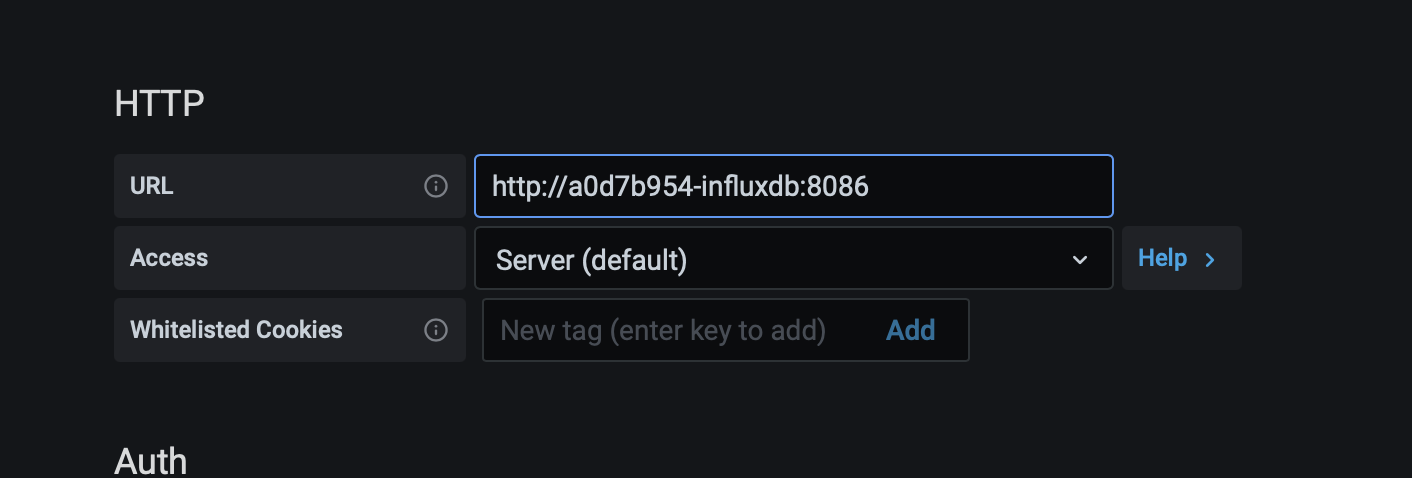
Once started go into the Documentation tab - and COPY this URL:
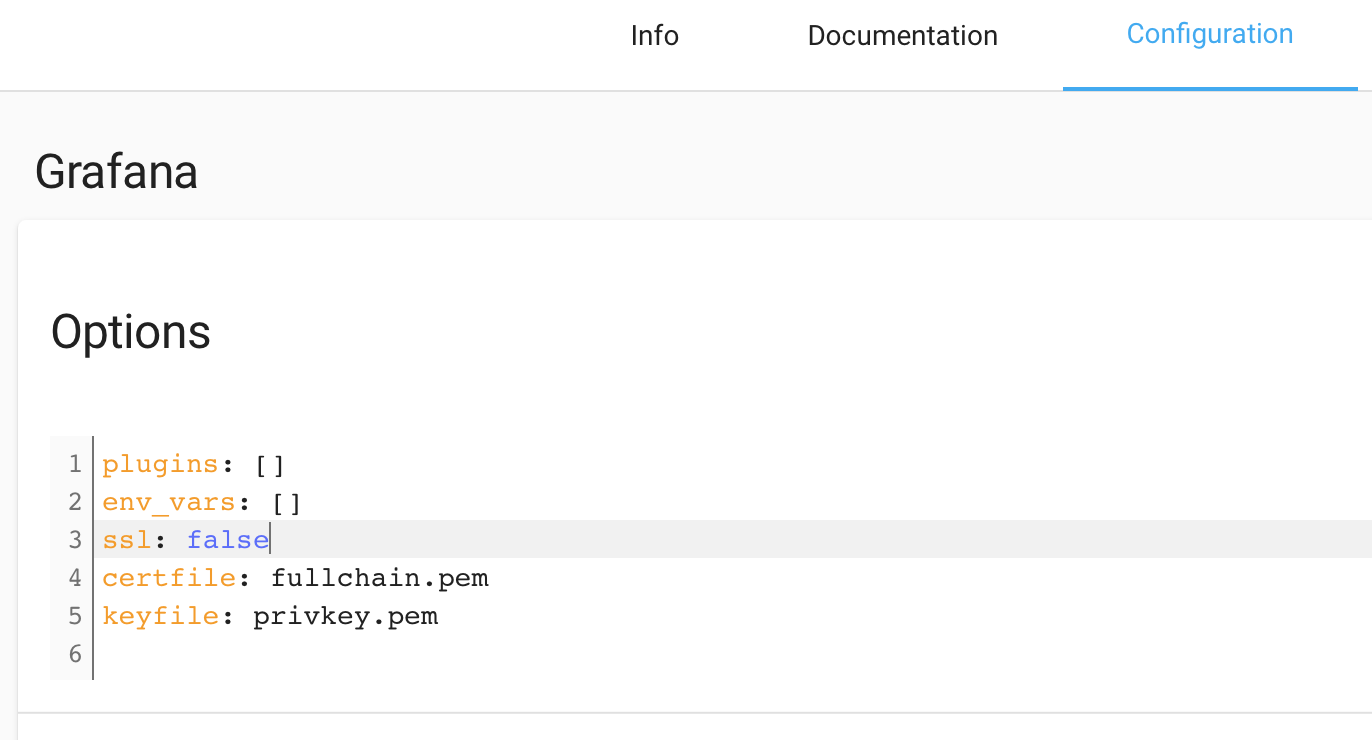
Go to the configuration tab and make sure SSL is false:
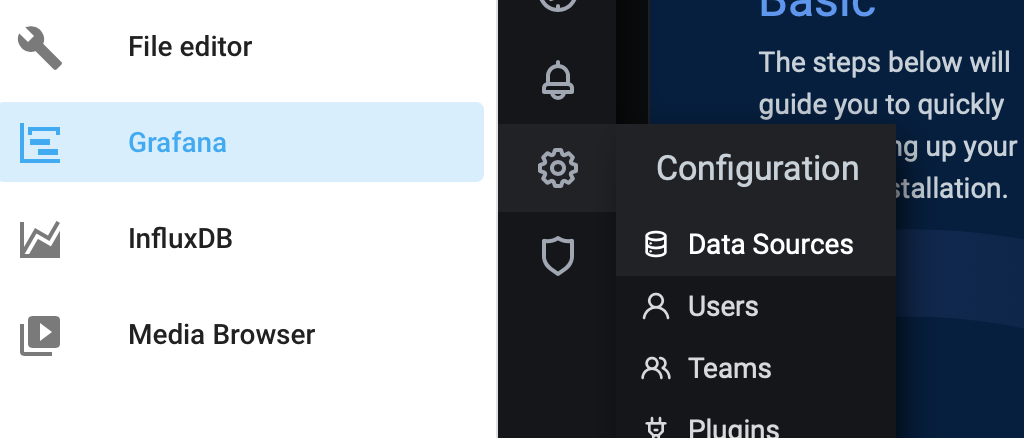
Now open up Grafana and click the configuration icon and go into the Data Sources:
Add a data source:
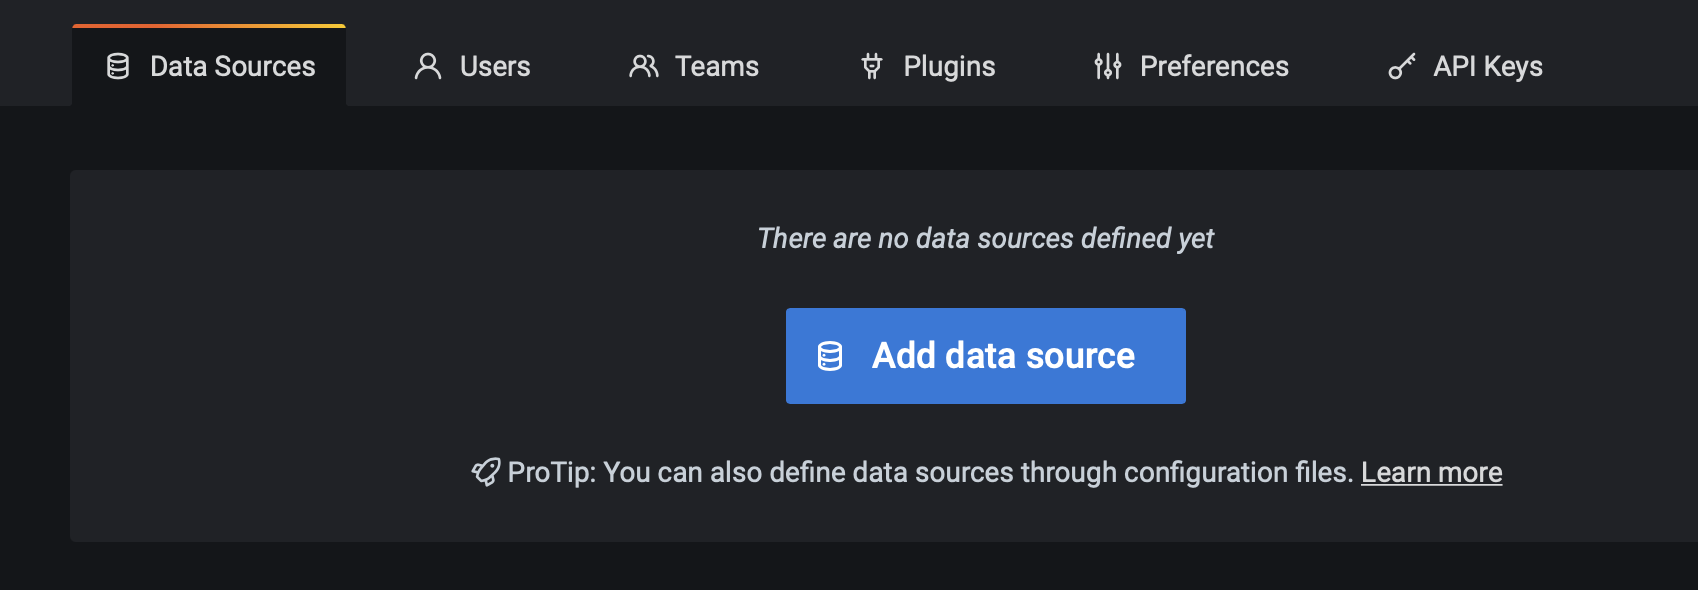
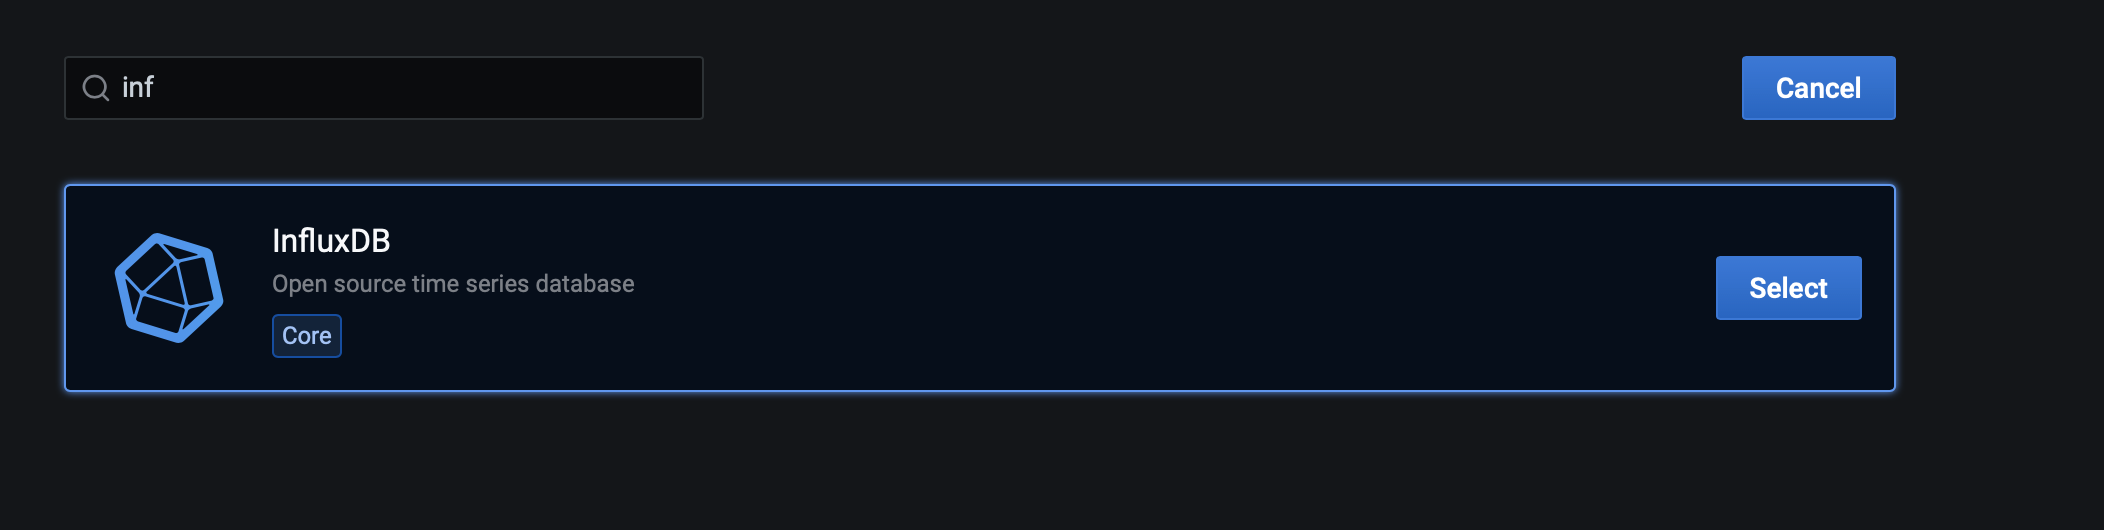
Search for InfluxDB and select that:
That URL we copied can be pasted here now:
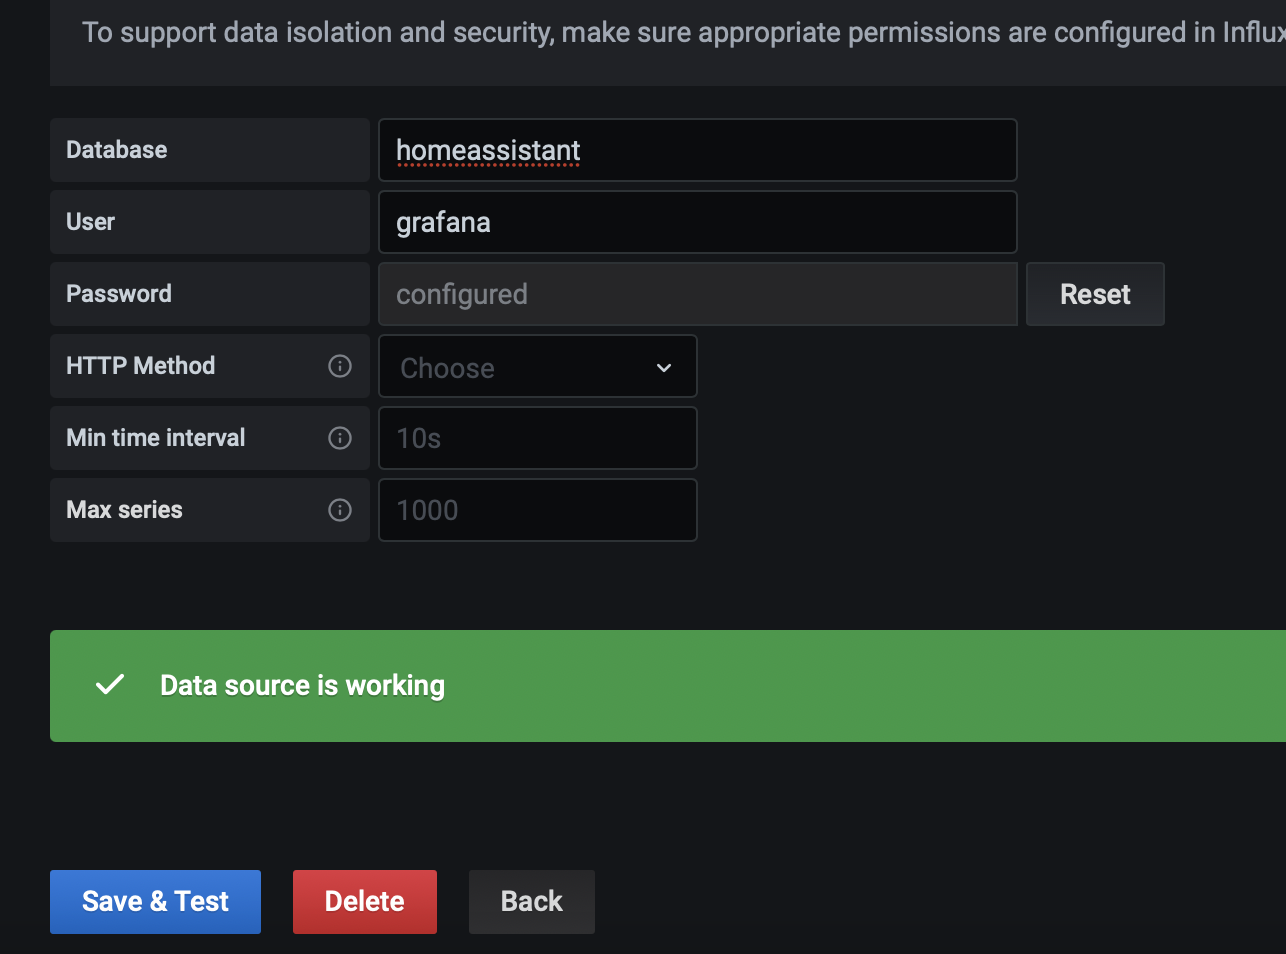
Enter in the homeassistant InfluxDB, then the user and password is the one we created for Grafana - Save & Test and you should see this:
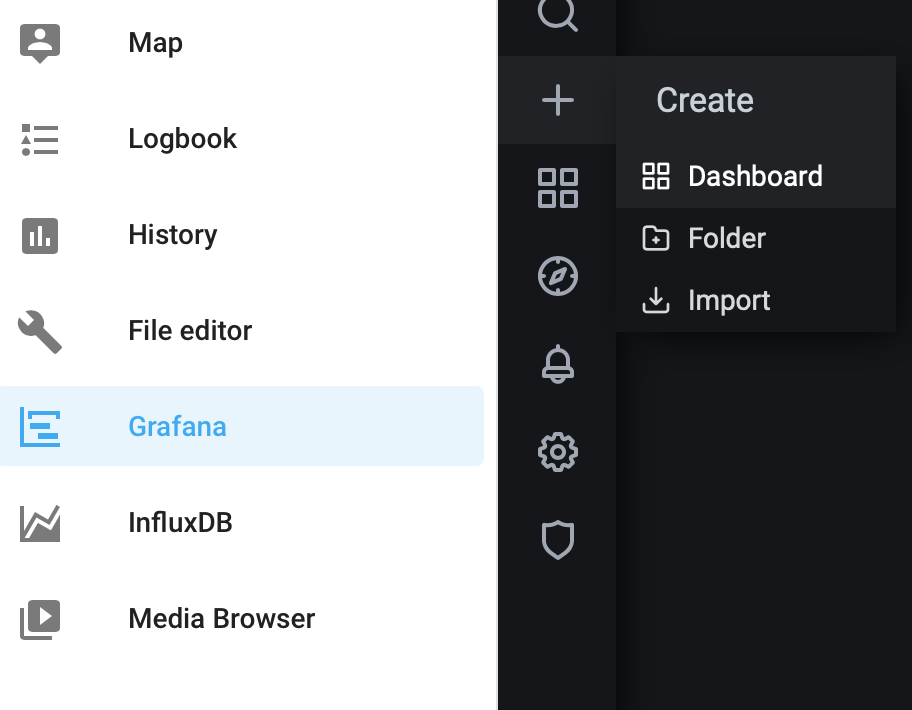
Create a Dashboard
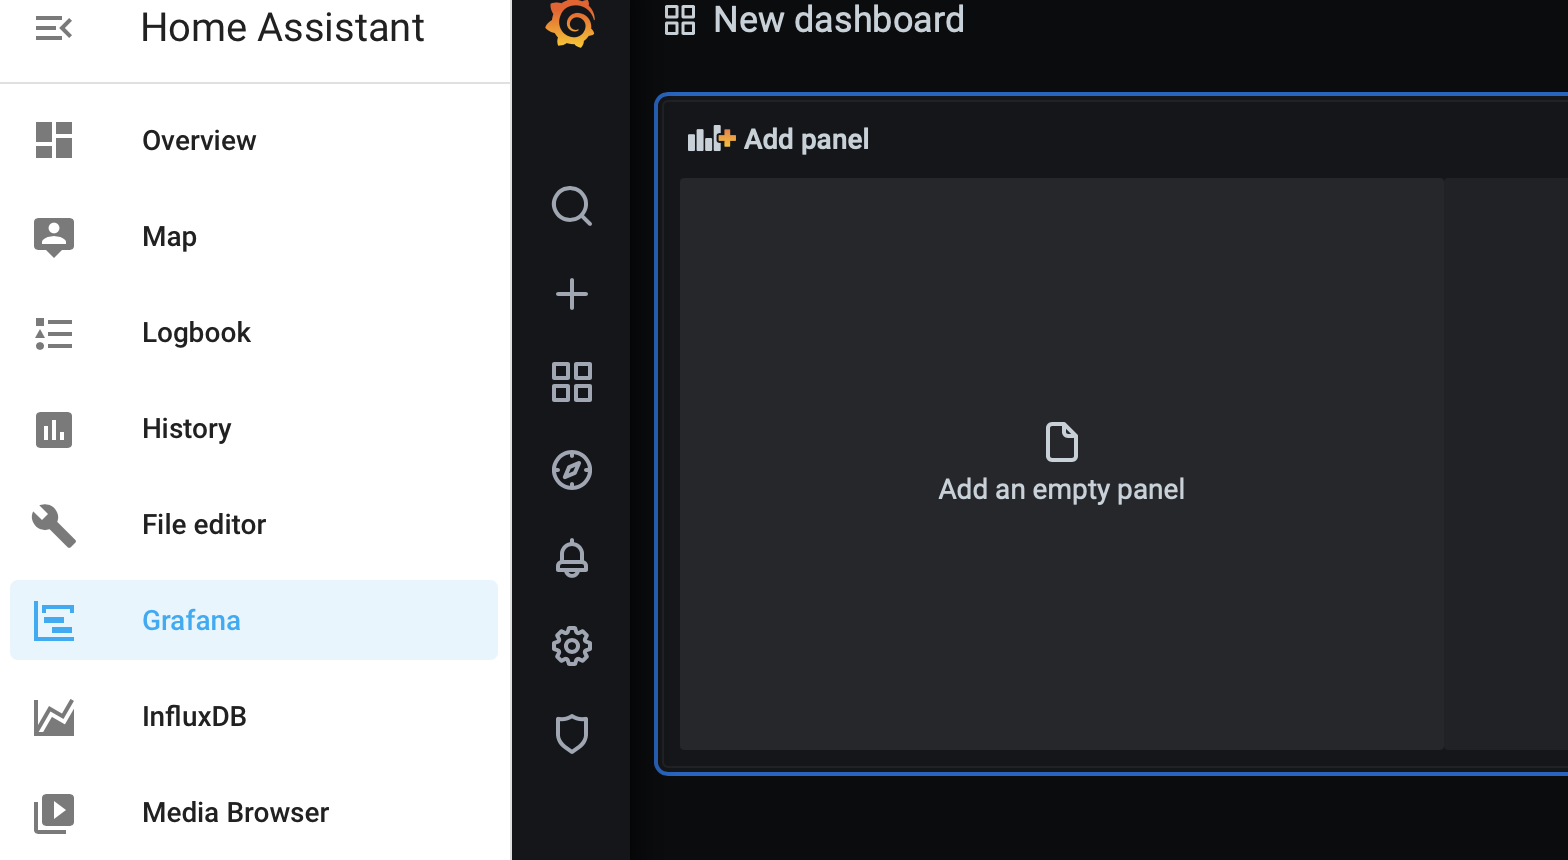
In Grafana, go and create a new dashboard, then add an empty panel:
Here we have a query where we can select anything we want to plot or even just display in text. I use it to create a beautiful looking dashboards.
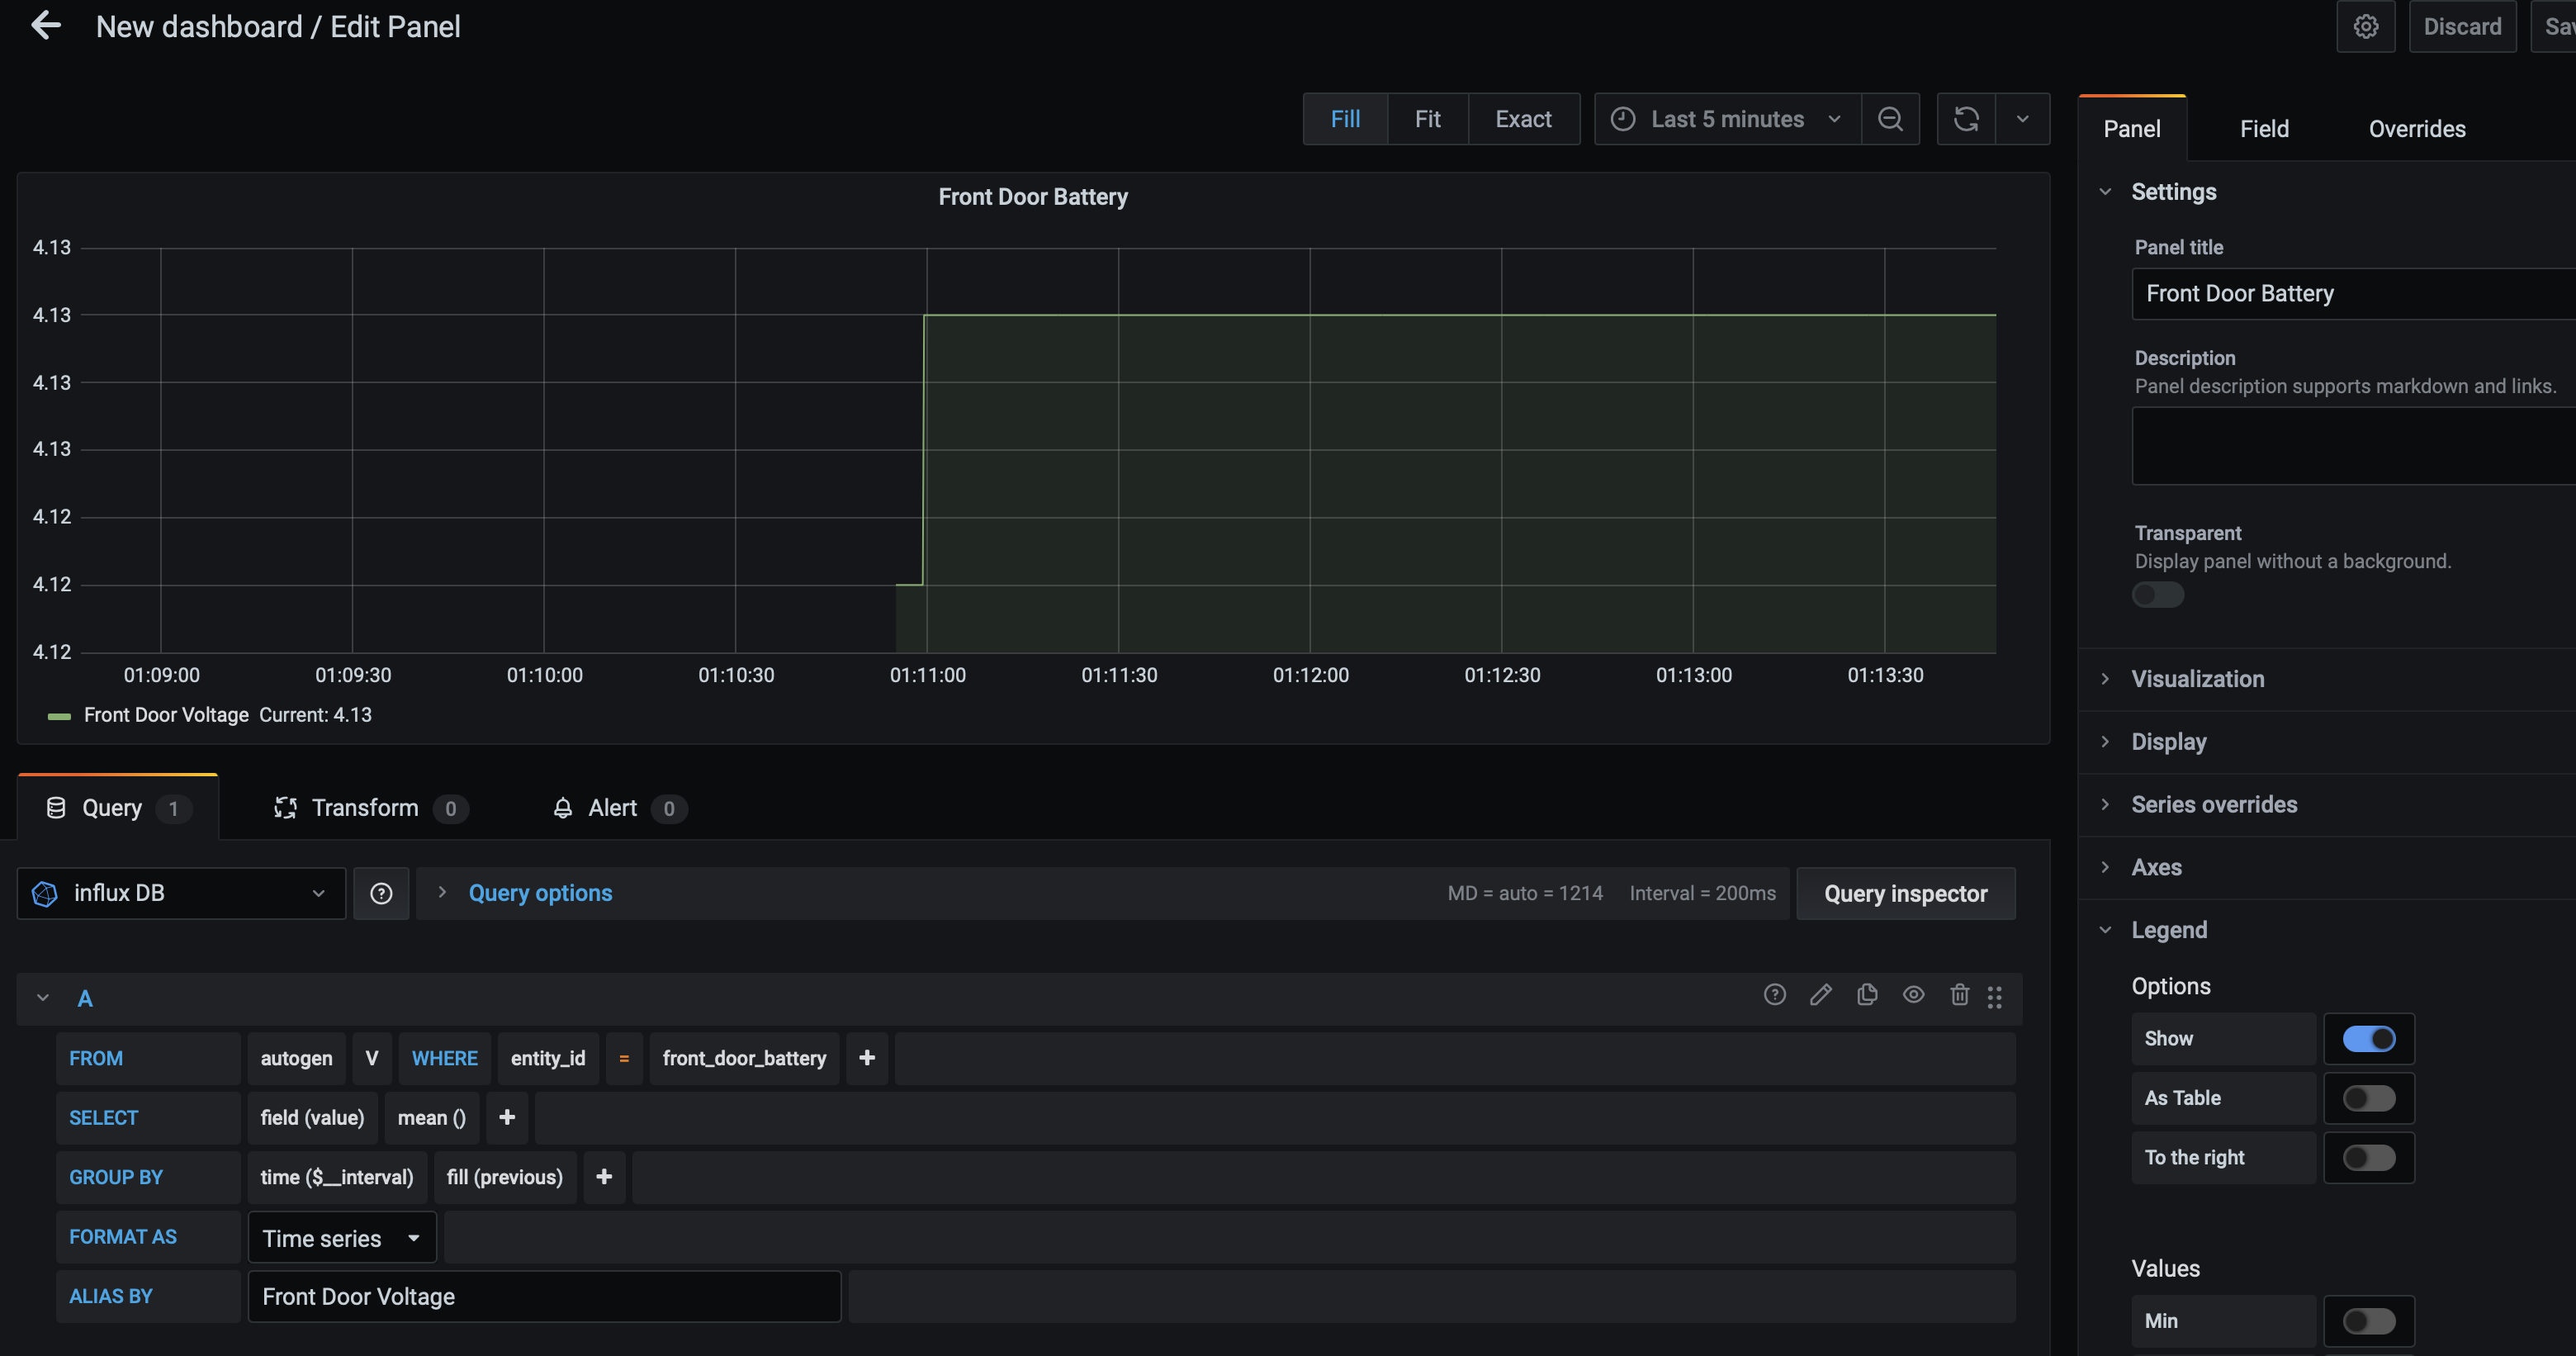
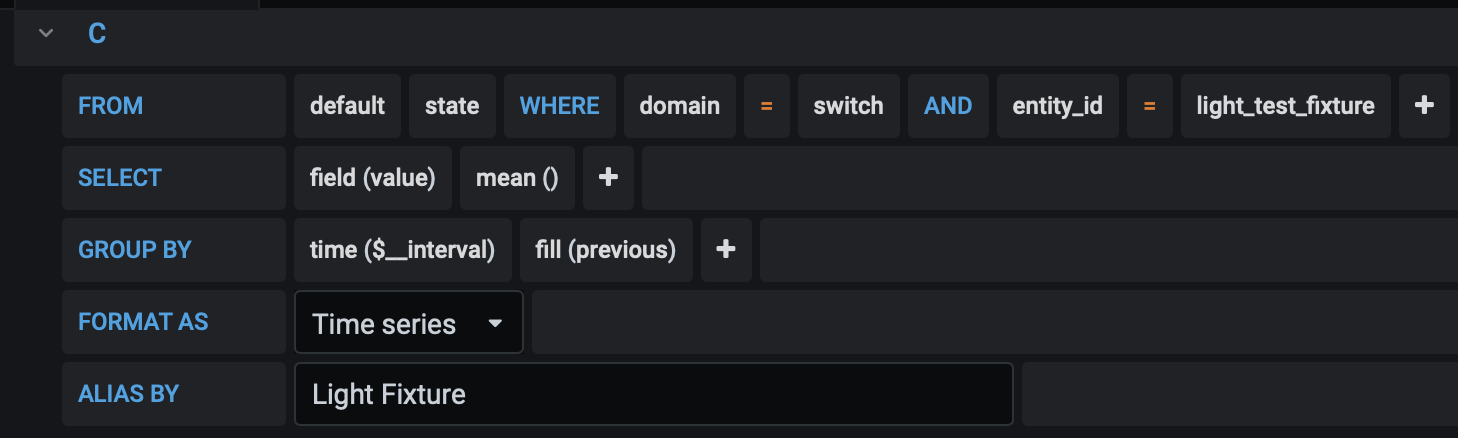
If we wanted to pull in and plot the battery voltage from a trigBoard, we can run a query like this:
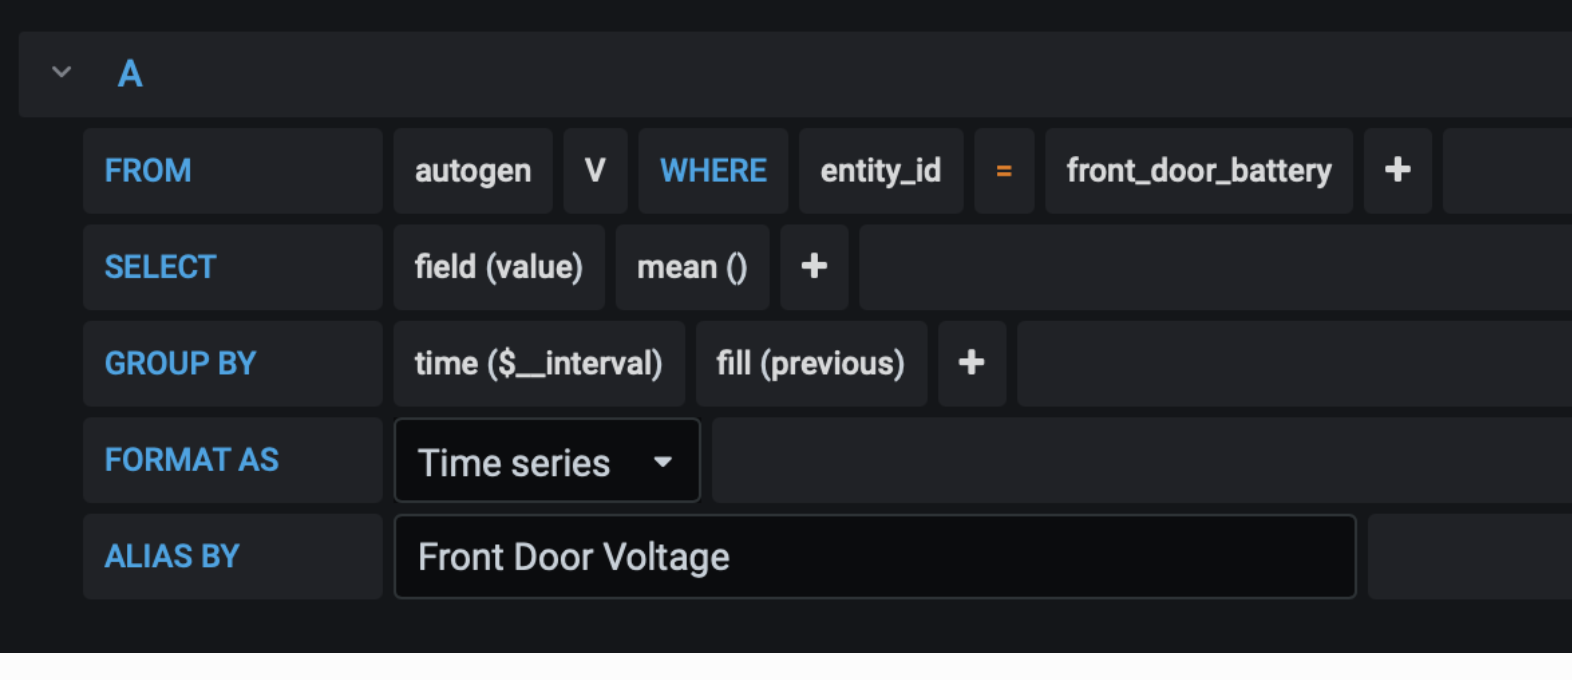
Then looks like this:
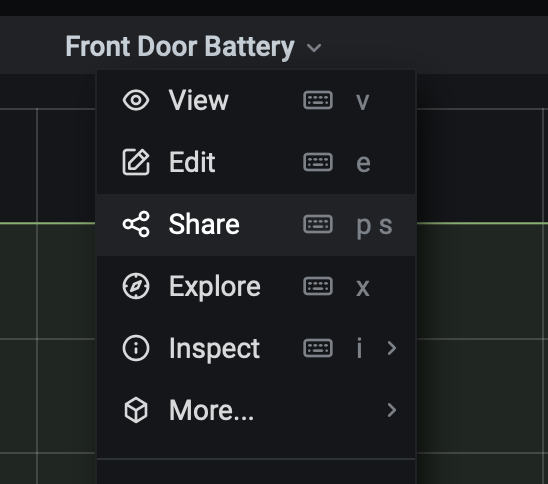
Then if you save this dashboard, you can share, then copy the link out:
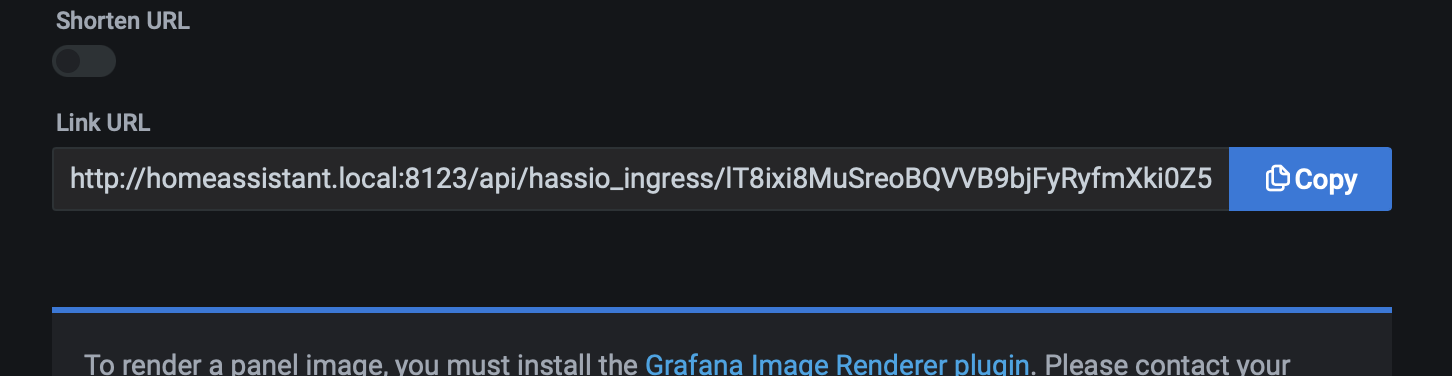
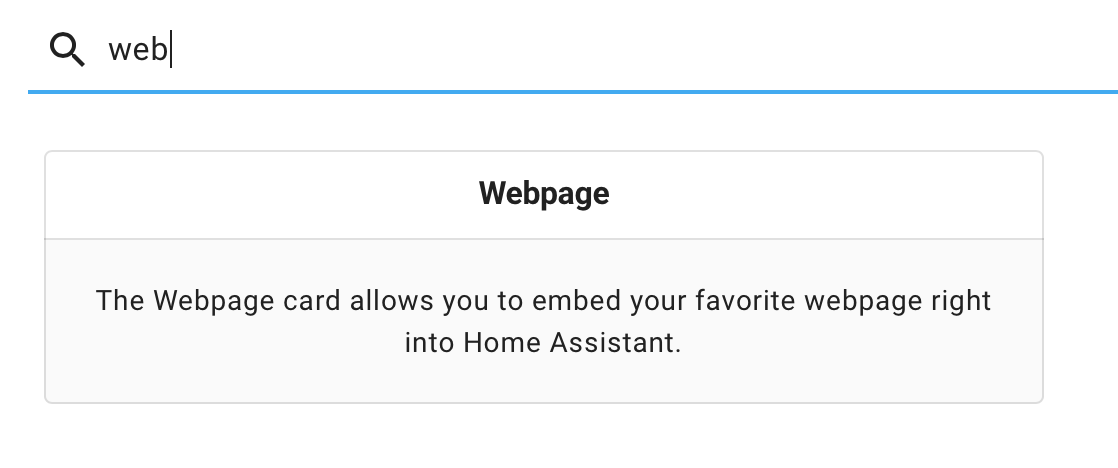
In your Home Assistant Dashboard, you can now create a webpage card and paste that URL in:
Now you have Grafana plots in your Dashboard!
Note that you can modify that URL to include the time frame and I recommend enabling kiosk mode, so only the plot is shown - here’s an example:
http://homeassistant.local:8123/api/hassio_ingress/lT8ixi8MuSreoBQVVB9bjFyRyfmXki0Z5rnit7RGHWo/d/xc8gaT9Mk/trigsolartest?orgId=1&refresh=30s&kiosk&from=now-24h&viewPanel=2
See the kiosk label in there, the auto refresh time at 30sec, the time frame is now-24hr to give last 24hours
Here’s a query I needed for an ESPhome device to get its state:
trigBoard activated WiFI Light Bulb
Want to do something useful with the trigBoard? In my house here, when I open the door into the garage, wouldn’t be handy to turn a light on automatically? Well this is a perfect application for trigBoard + Home Assistant. Even better, this trigBoard can still send push notifications out using any of the other services - you’re just enabling MQTT as a next step in the sequence in the logic for when the trigBoard wakes. You’ll see below how this can be done.
WiFi Bulb Setup
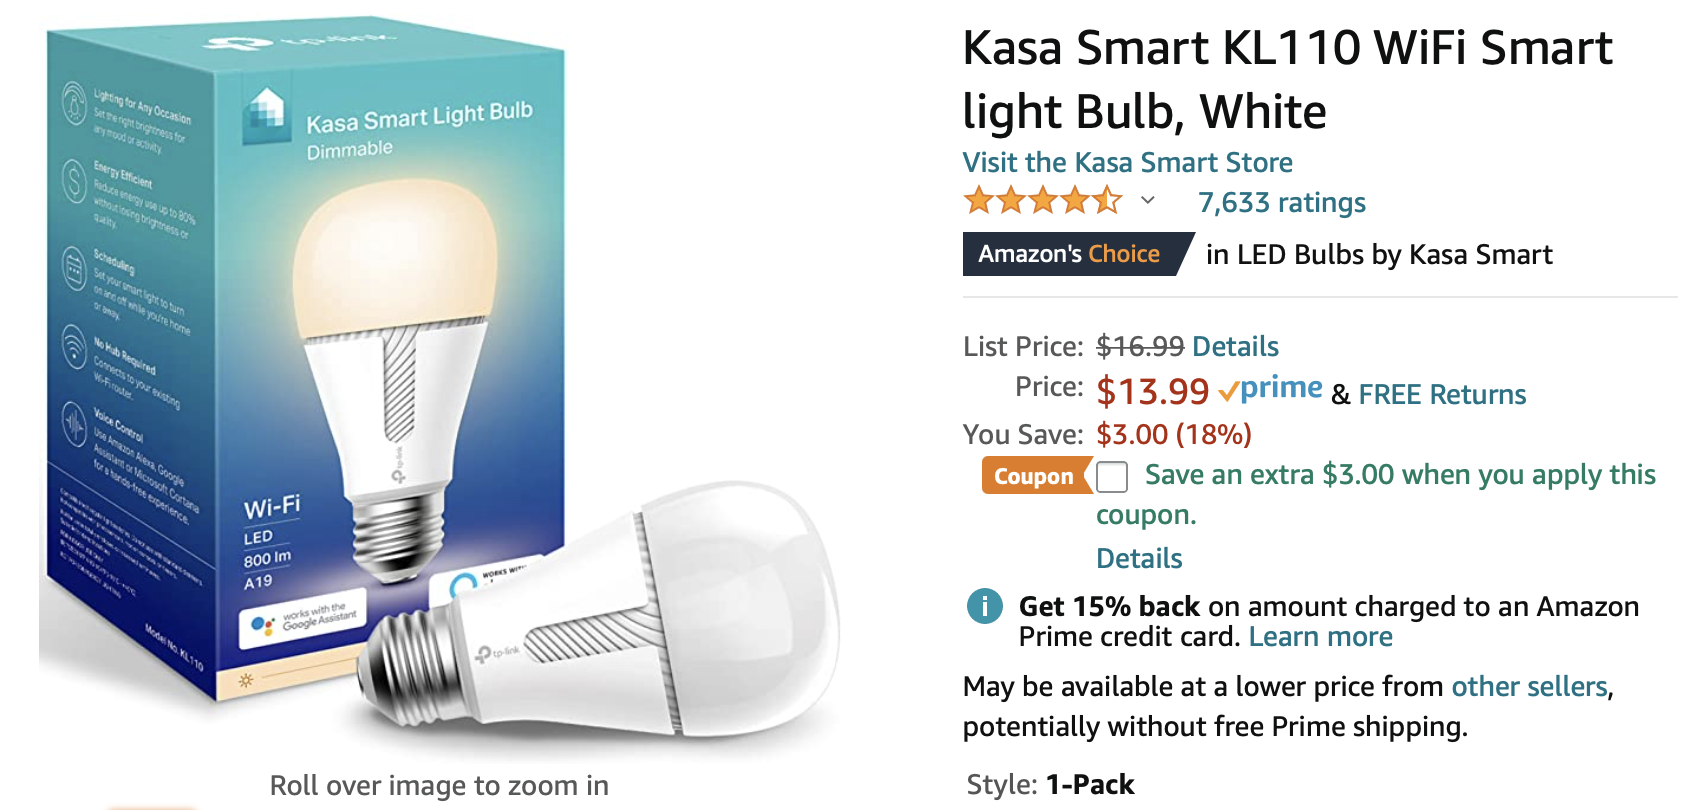
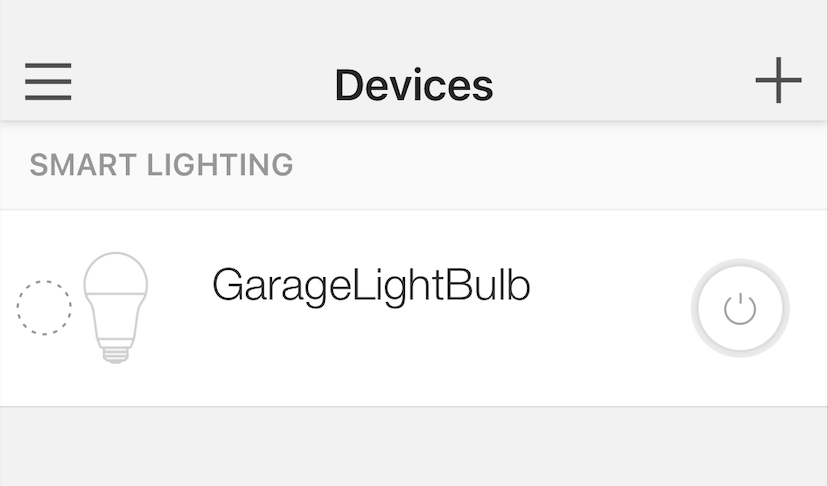
I didn’t want to have to deal with re-flashing a cheap WiFI bulb or worry about a gateway with ZigBee bulbs, so I decided on a TP-Link “Kasa” KL110 bulb picked up on Amazon
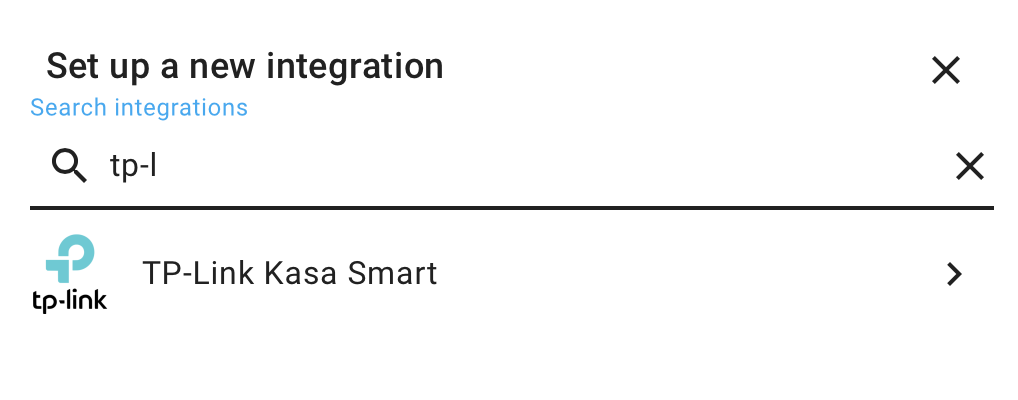
Add TP-Link Integration to Home Assistant: Configuration>>Integrations, then bottom right click Add Integration, search for TP-Link
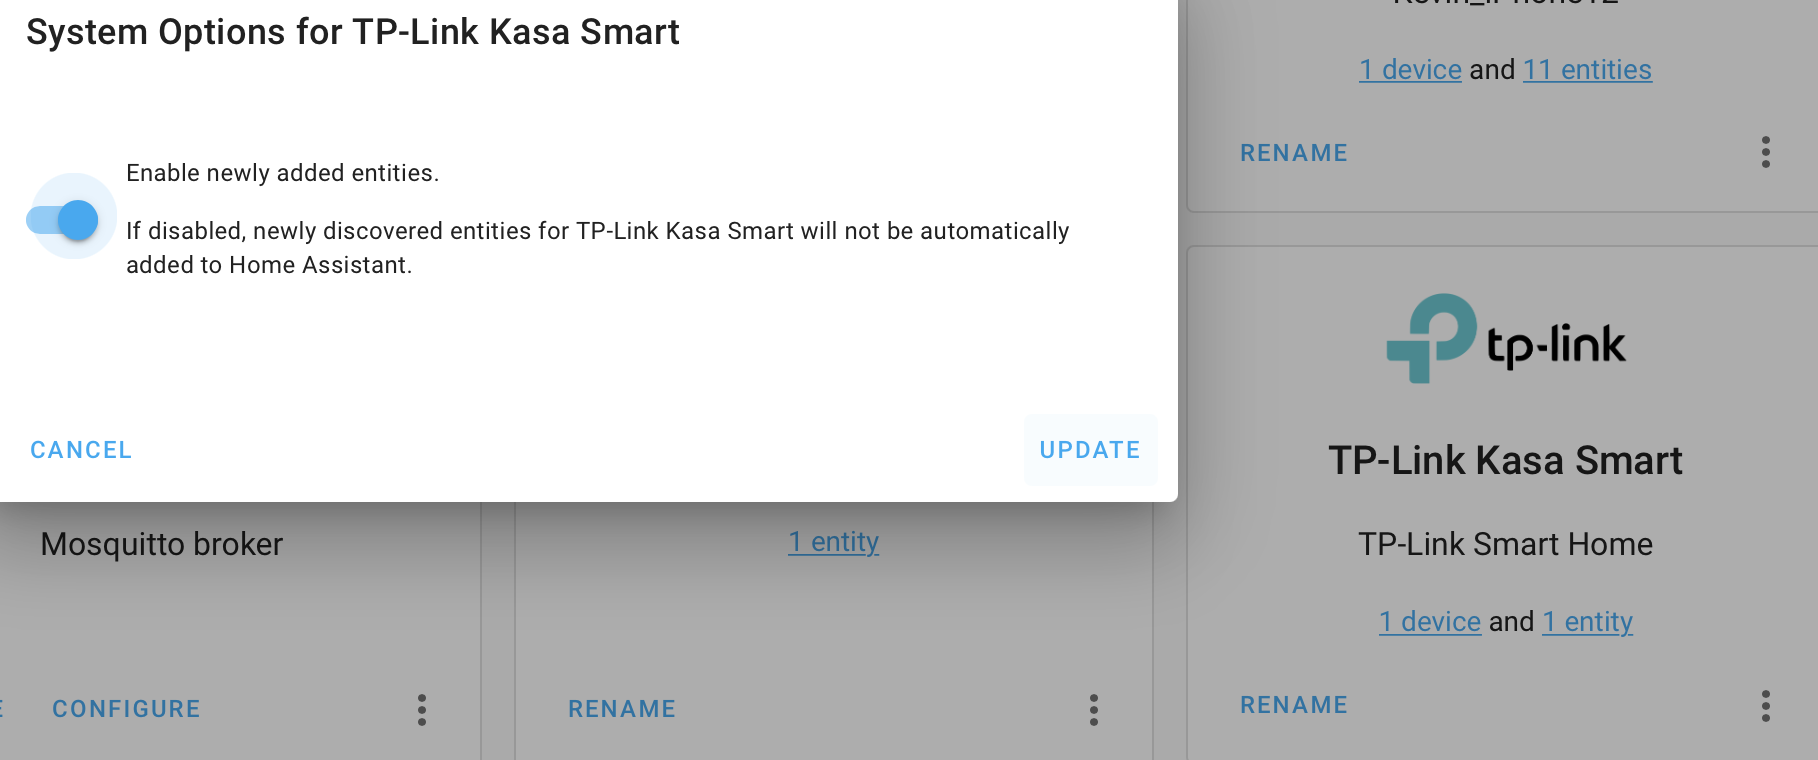
I clicked the three dots in the integration, system options, then update:
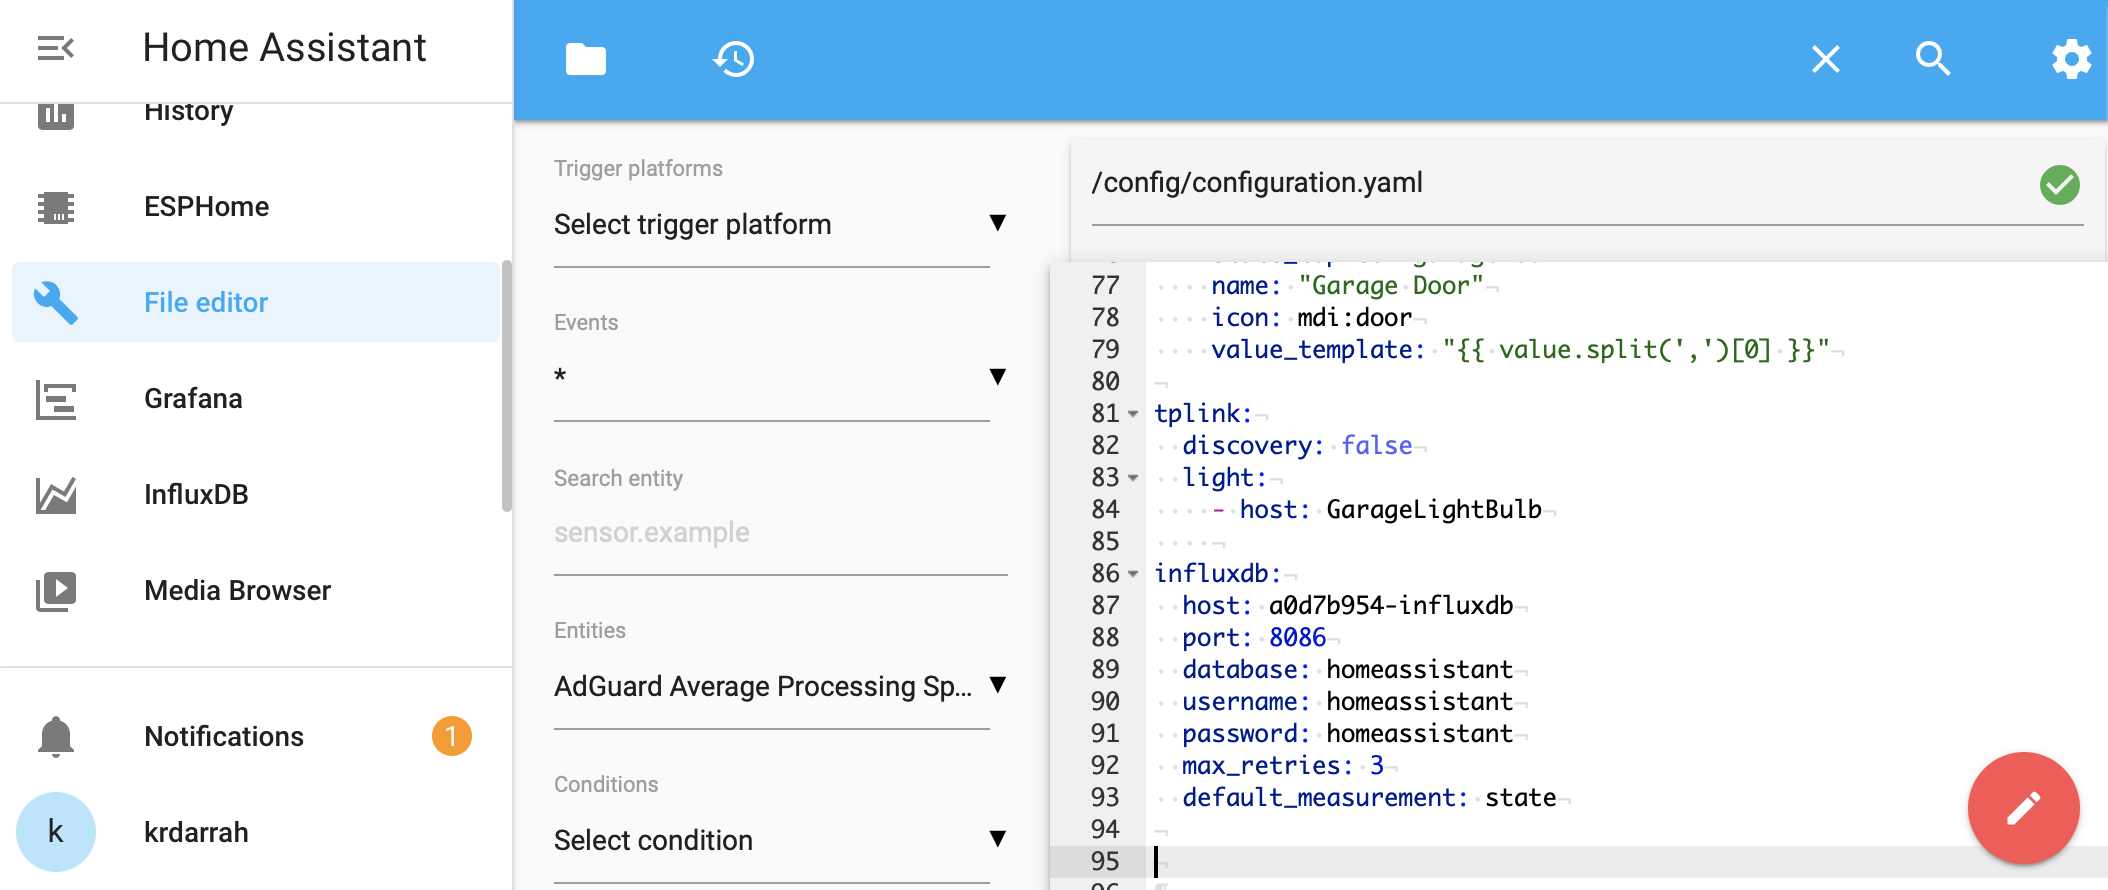
In File Editor, we add the tplink device with the bulb name we had in the app:
tplink:
  discovery: false
  light:
    - host: GarageLightBulb
Mine looks like this:
More info here
After saving that, I gave my Home Assistant a restart: Configuration>>Server Controls, then click Restart under Server management.
Once things are back online, try creating a new Bulb card in a dashboard and see if you can select that Entity:
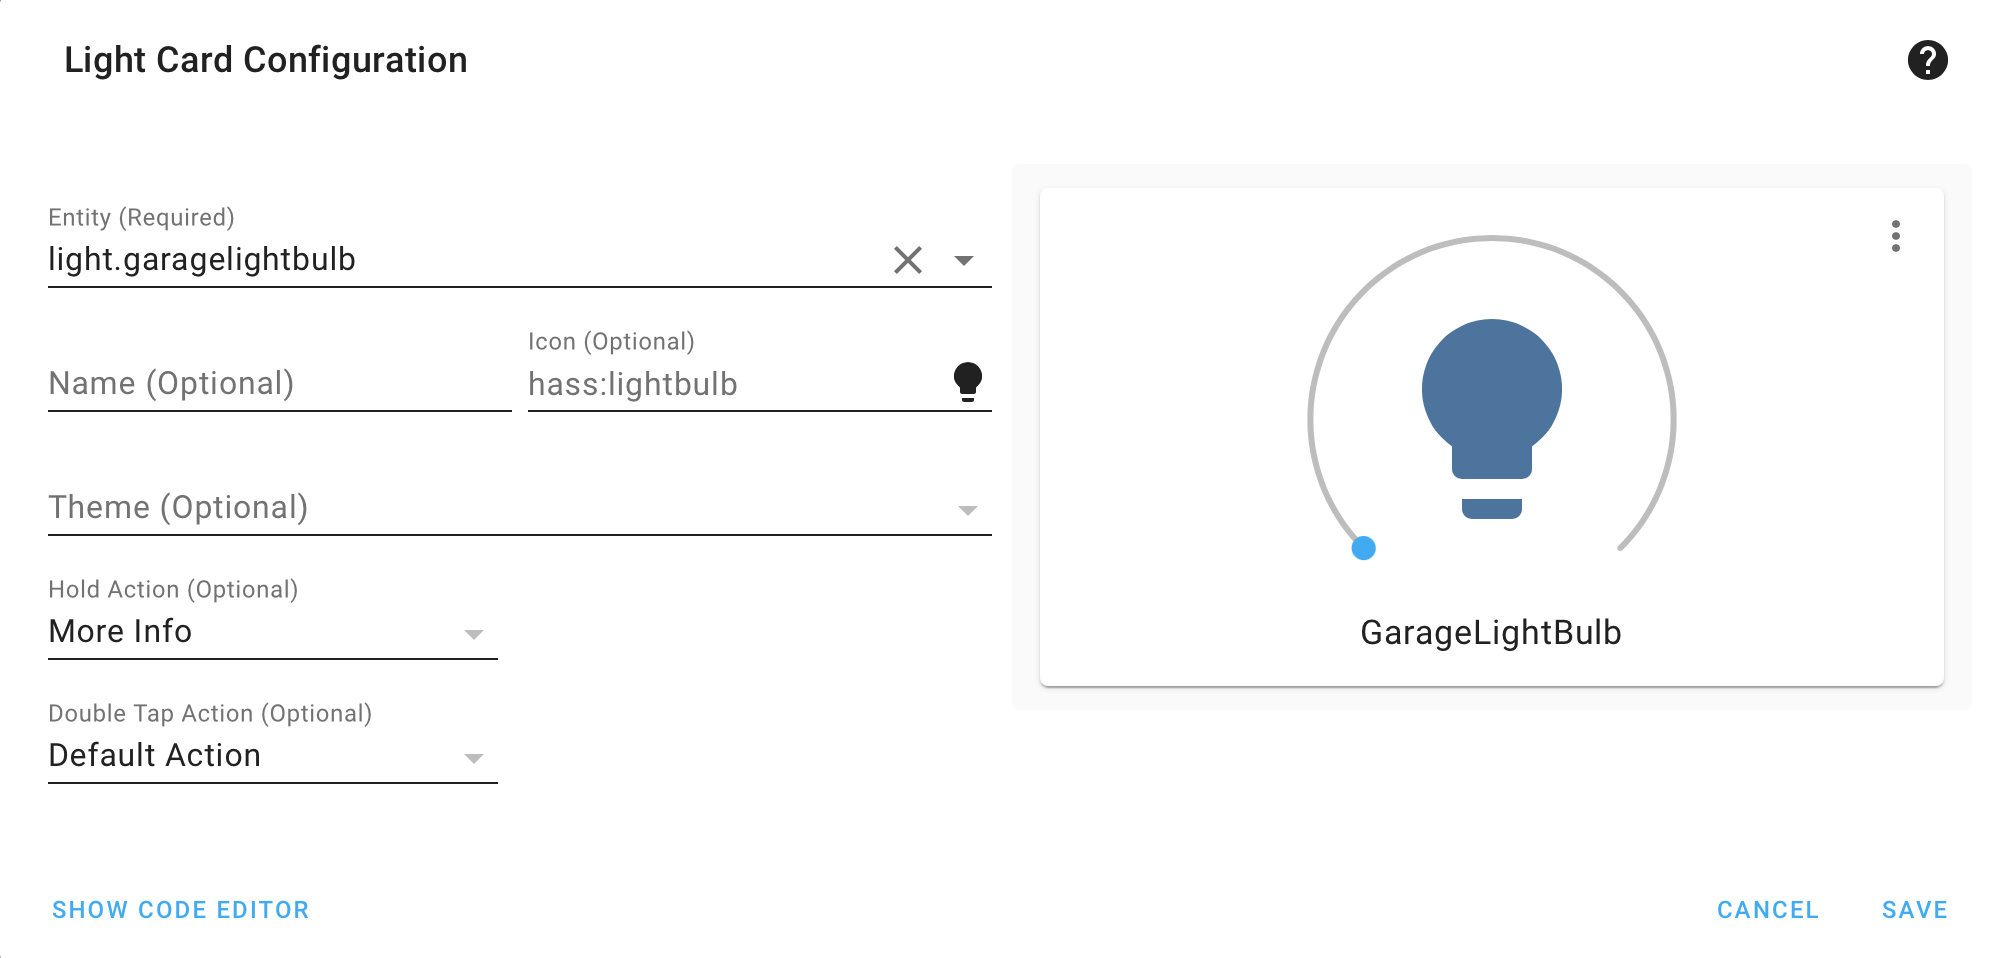
You should be able to turn the bulb on and off and adjust brightness. IMPORTANT set the desired brightness you want for the bulb here, then just turn it off. From the trigBoard, we’re just going to toggle it on/off.
Then that’s all we need to do with the Bulb!
trigBoard Setup
Note
If you’ve followed the guides above and already have a trigBoard displaying a state change, then you’re good to go and can proceed to the next step, but this will show how to setup a trigBoard that is already in service and if you only want to expand it’s features to now activate a light with Home Assistant
In this case, I have a trigBoard already sending push notifications per The Cellular Backed Setup using TCP so I really didn’t want to modify any of my push messages or other parameters. This is no problem and easy enough to just enable MQTT. NOTE you still need to make sure you have the Mosquitto Broker working within Home Assistant, so make sure to follow guides above on setting up Home Assistant with the Broker.
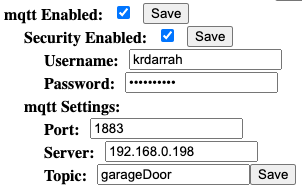
Back to Home Assistant straight into the File Editor, you can add this sensor and note the value template - we’re just going to take the full trigBoard message out here without the voltage (we don’t care about that for what we’re doing). Note the topic here matches what was entered in the Configurator:
sensor:
  - platform: mqtt
    state_topic: "garageDoor"
    name: "Garage Door"
    icon: mdi:door
    value_template: "{{ value.split(',')[0] }}"
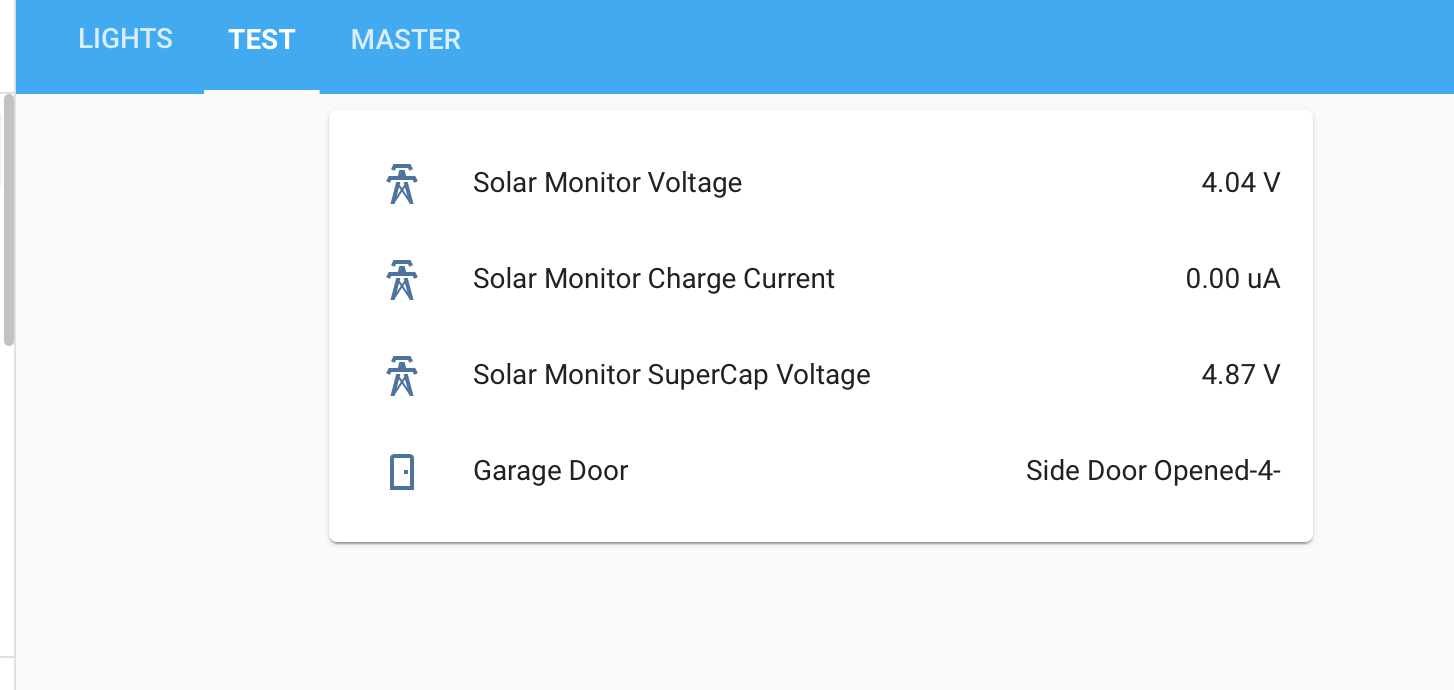
This will produce these messages:
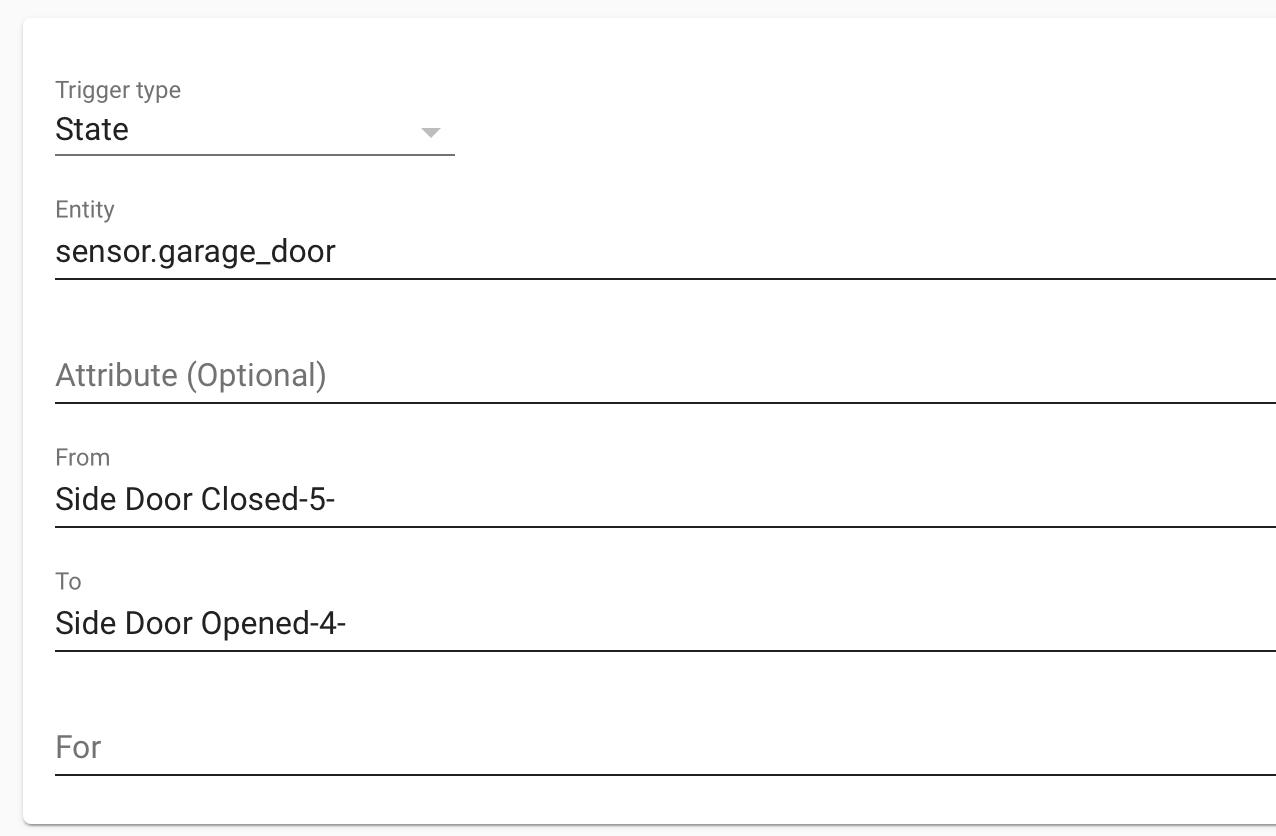
Side Door Opened-4-

Side Door Closed-5-
Go to Configuration>>Server Controls and click on the button to reset the MQTT entries “MANUALLY CONFIGURED MQTT ENTITIES”
You can go and create an entities card just to test and make sure you’re seeing the open/closed messages come through:
All done!!
Automation Setup
You can get really creative here, but I’m boring and just want to turn that light bulb on for 5 minutes when the door opens… that’s it! And so easy with Home Assistant!
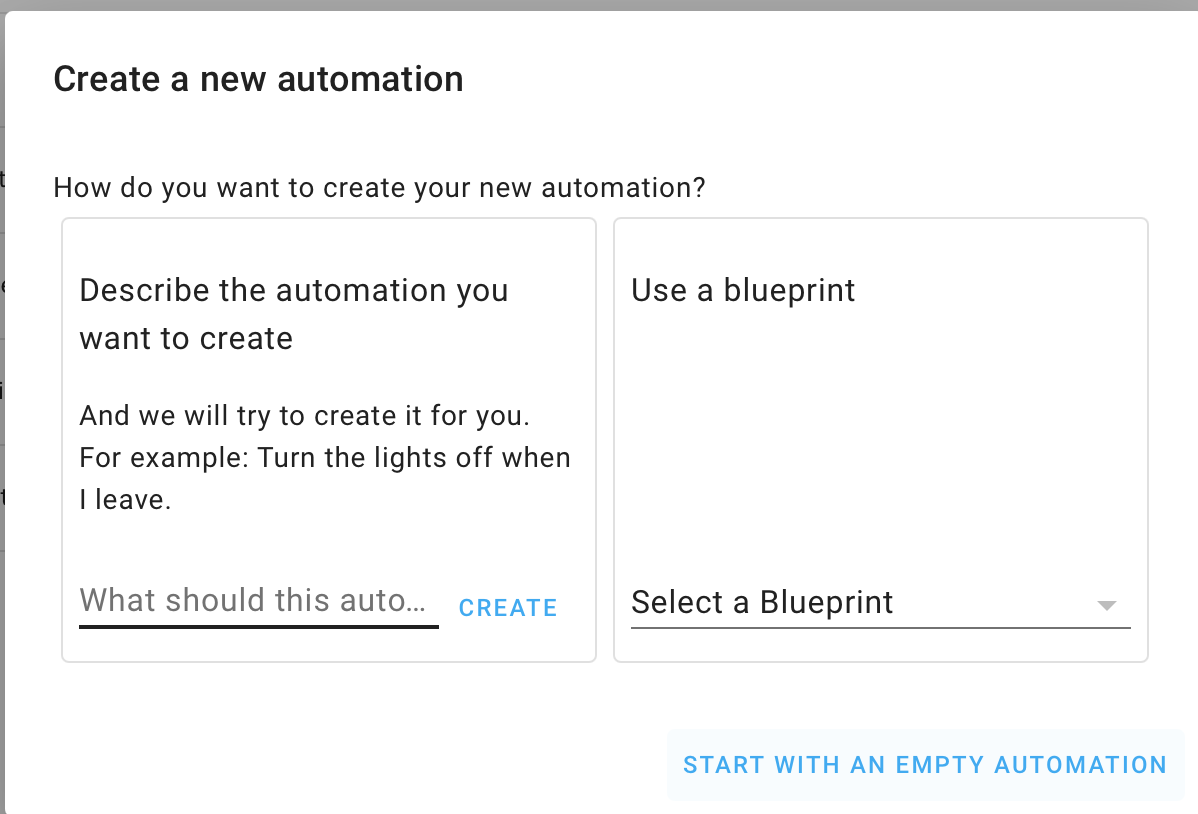
Configuration>>Automations Then create a new Automation, and start with a empty automation:
Give it a good name, then scroll down to triggers, and this is dead simple, we’re going to trigger on that trigBoard state as it changes from closed to open.
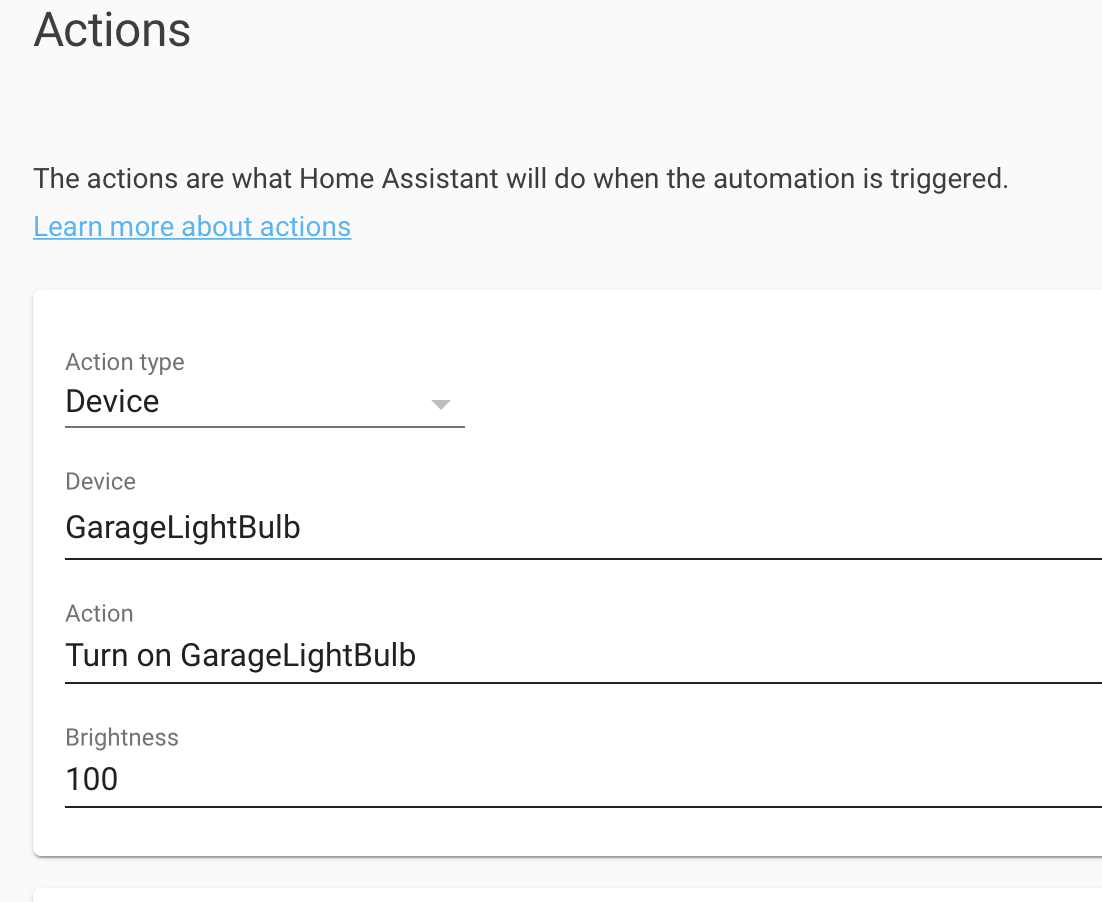
Scroll down to Actions, and this is simple too, just turn that garage bulb on:
So that turns the bulb on, but then to turn off after 5 minutes, I added a delay action for 5minutes, then another state action to turn the bulb off:
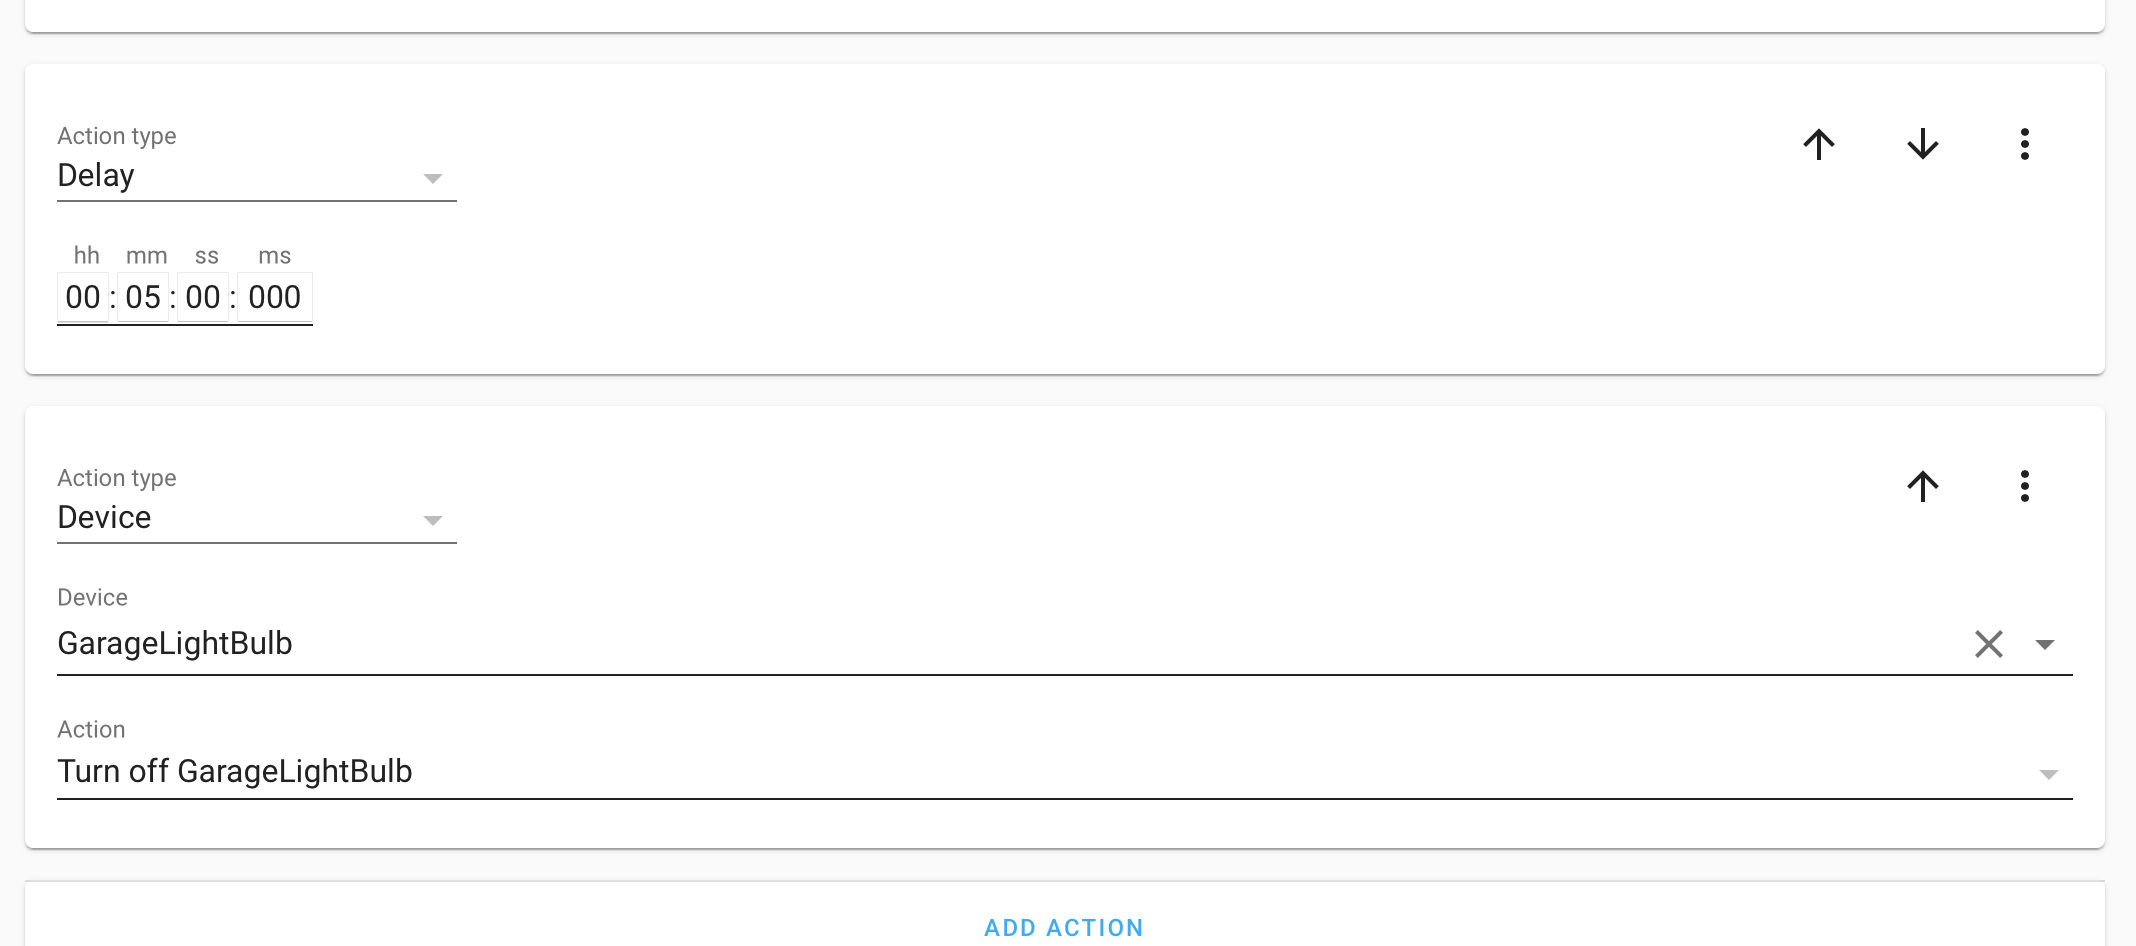
That’s all there is to it! Don’t forget to save, then should be good from there!